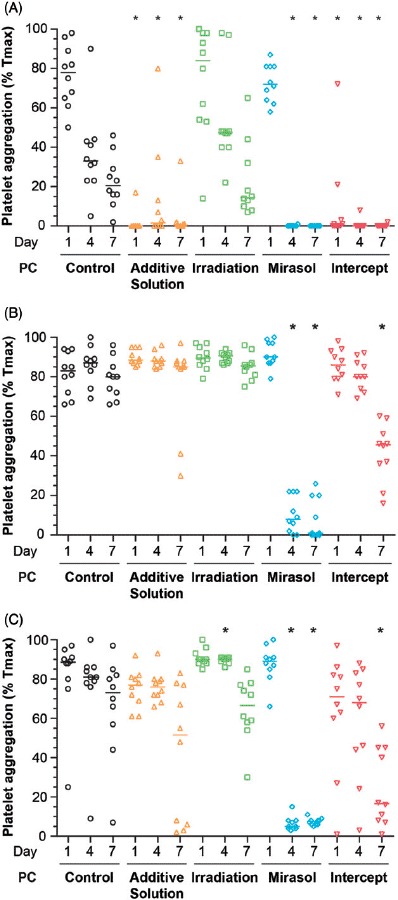
Figure 7.

Effect of storage in additive solution or treatment with Irradiation, mirasol, or intercept on platelet aggregation. The figure shows the aggregation response to 20 µM ADP (A), 40 µM TRAP (B) and 4 µg/ml collagen (C) of samples collected from the PCs on day 1, 4, or 7 for each group (control, additive solution, Irradiation, mirasol, or intercept). Individual results from each PC, expressed as a percentage of maximal transmission (Tmax), are shown along with the median (n = 10 donors per group). All comparisons were two-sided. ∗p < 0.05, namely a statistically significant difference in aggregation in the corresponding treatment (compared with the control) group on the same day of storage.
