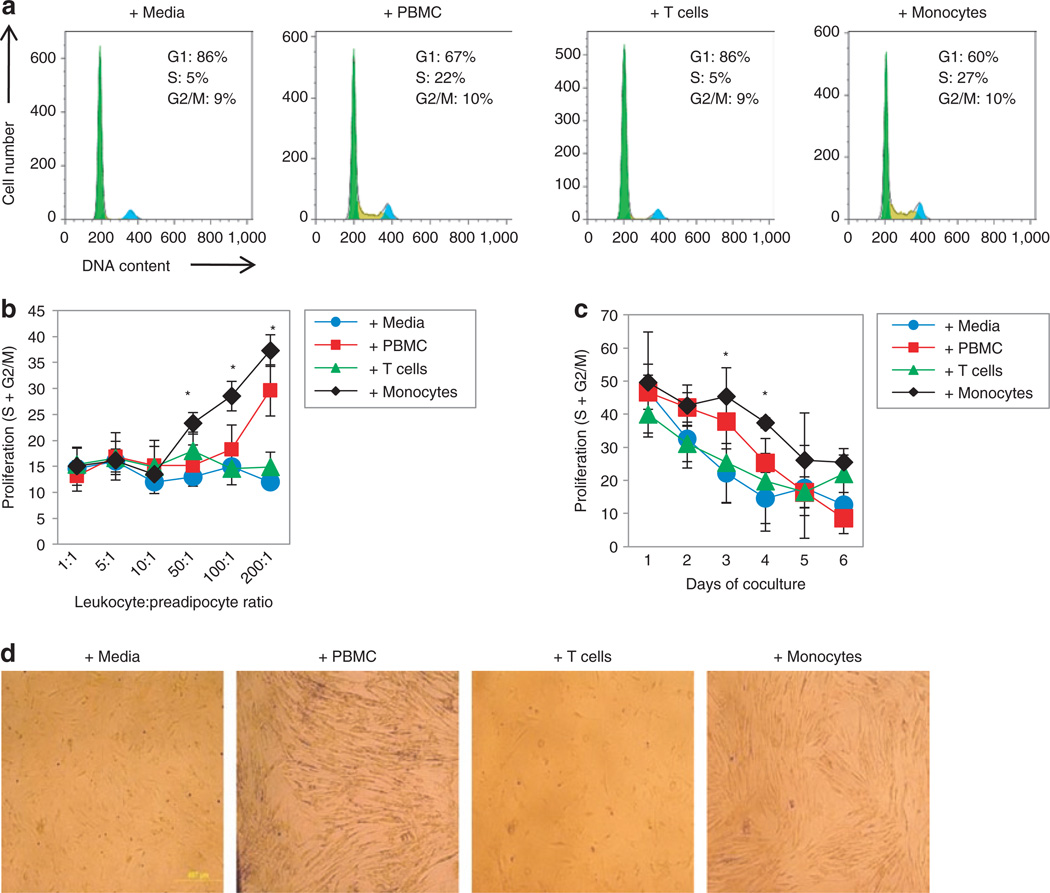
Figure 1.
Cell cycle and proliferation of human subcutaneous preadipocytes during coculture with PBMCs, T cells, or monocytes. Preadipocyte cell cycle was measured by flow cytometry after staining with a DNA dye, and the G1, S, and G2/M phases were delineated using FlowJo analysis software. (a) Representative cell cycle histograms of preadipocytes after 3 days of culture with control media, PBMCs, T cells, or monocytes. (b) Proliferation of preadipocytes after 3 days of coculture with increasing numbers of PBMCs, T cells, or monocytes. Proliferation was determined by addition of the S and G2/M phases of the cell cycle. N = 3, error bars are means ± s.d., *P < 0.05 compared to control media. (c) Proliferation of preadipocytes during coculture with PBMCs, T cells, or monocytes for up to 6 days at a 50:1 leukocyte:preadipocyte ratio. N = 3, error bars are means ± s.d., *P < 0.05 compared to control media. (d) Representative phase contrast microscopy images (×40 magnification) of preadipocyte confluency after 6 days of coculture with PBMCs, T cells, or monocytes. PBMC, peripheral blood mononuclear cell.

