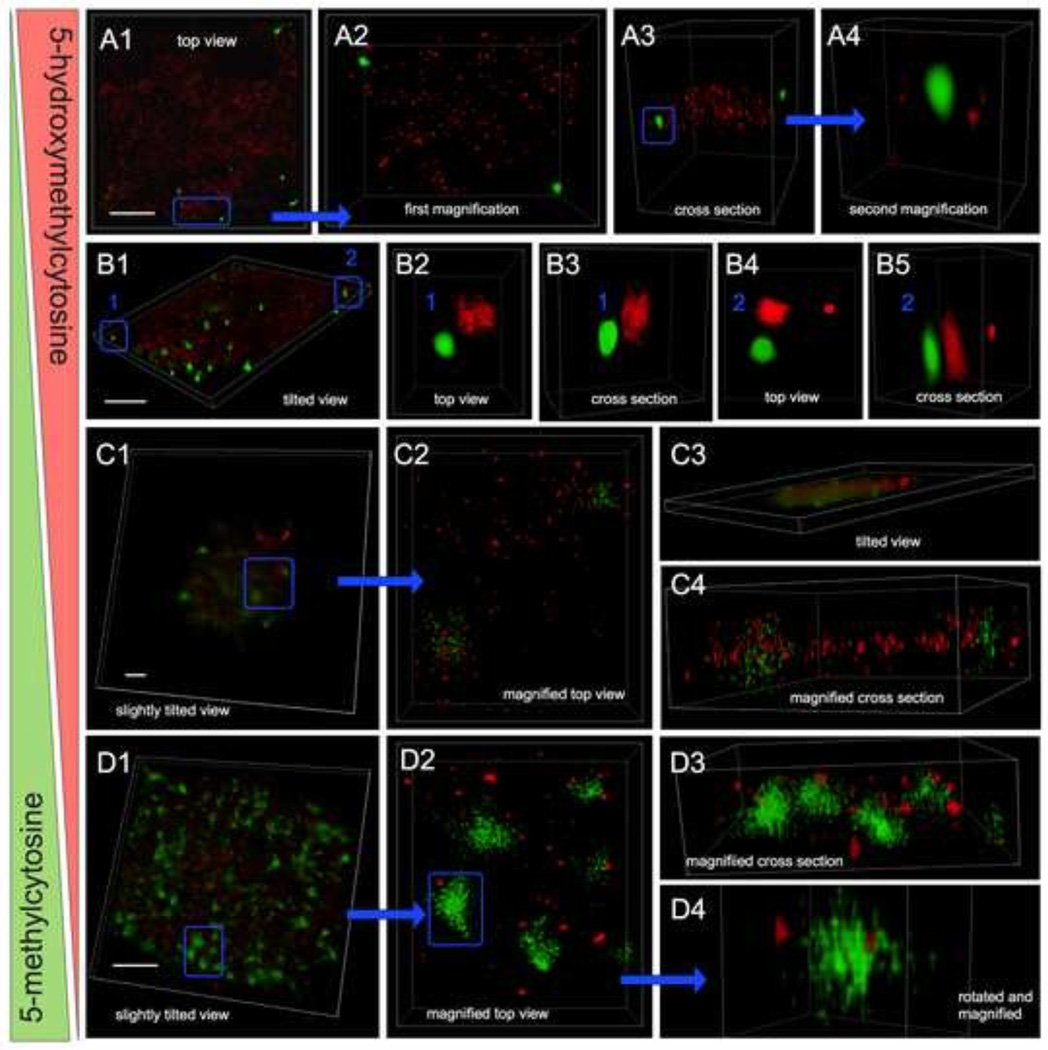
Fig. 3.
Dynamic nuclear topology of 5mC and 5hmC of day-10 cells as disclosed by 3-D superresolution localization using ground state depletion nanoscopy. Images were taken from midsections of cells that had been dual-labeled for 5hmC (red) and 5mC (green). No DAPI counterstaining was used, as it would have caused bleed-through of the DAPI signal into all other channels, due to the use of high-power lasers necessary for GSD. Panels A–D: 3-D reconstructions revealed nuclear abundance and spatial distribution of both cytosine variants within nuclear DNA and the degree of colocalization in sub-genomic regions. Each panel represents one nucleus, with sub-regions (framed in blue) being magnified and displayed at various angles (top views and cross sections). 5hmC showed a more punctate and dispersed pattern, whereas 5mC appeared more concentrated in larger foci. In nuclei with higher 5hmC and lower 5mC content (supposedly in pluripotent cells) the two types of molecules occupied separate areas, even at closer proximity (A4 and B2–B5). In contrast, in nuclei of transitioning cells with approximately equal amounts of both cytosine variants, the two analogs colocalized in less-condensed foci (C2 and C4). Finally in cells with an overwhelming 5mC pattern and relatively minimal 5hmC signals (assumingly representing early-differentiated cells), the two cytosine variants were seen more apart similar to pluripotent cells; with a few larger 5mC foci harboring 5hmC sites as seen in Fig. D4. White bars are 2 µm.

