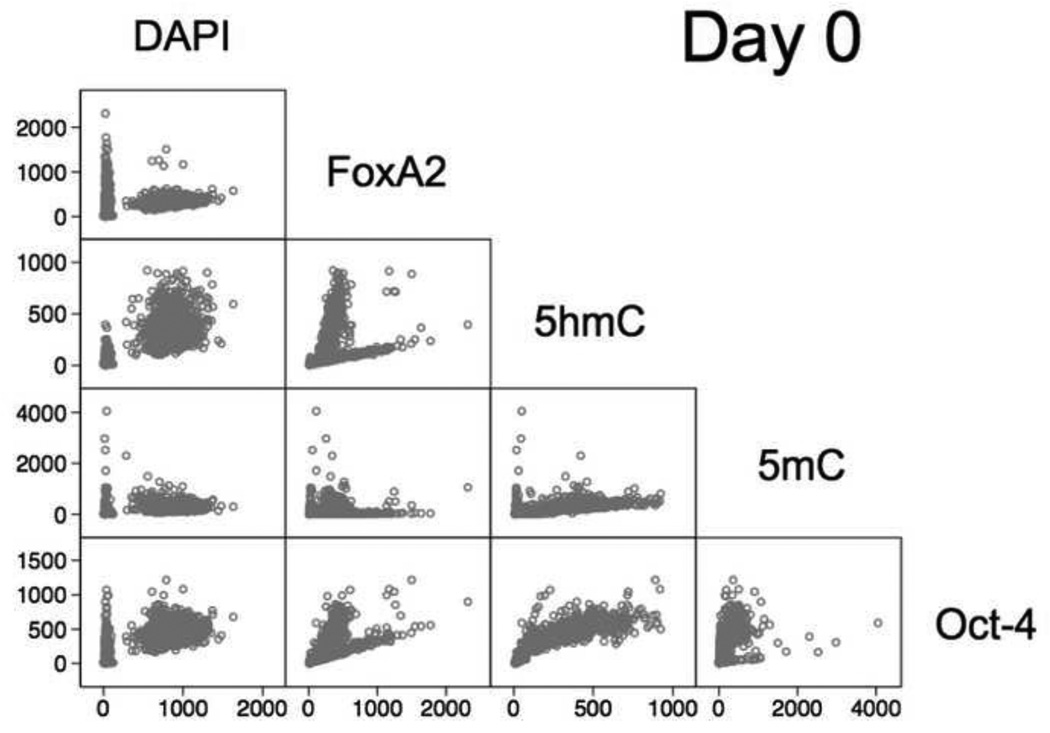
Fig. 4.
Graphical summary of the correlation of the overall intensities of the five markers (signal channels), i.e. DAPI, FoxA2, 5hmC, 5mC, and Oct-4 and display as a matrix of 2-D scatterplots for day 0: whereby each plot represents the pairwise values of two channels per cell/nucleus (hollow dot). The individual plots indicate the coexistence of different subgroups. Particularly, in the DAPI-specific plots we observed two cell fractions, with one fraction having very low DAPI intensities and low to high intensities for the other channels (markers), therefore suspected to represent perishing cells and cell debris.

