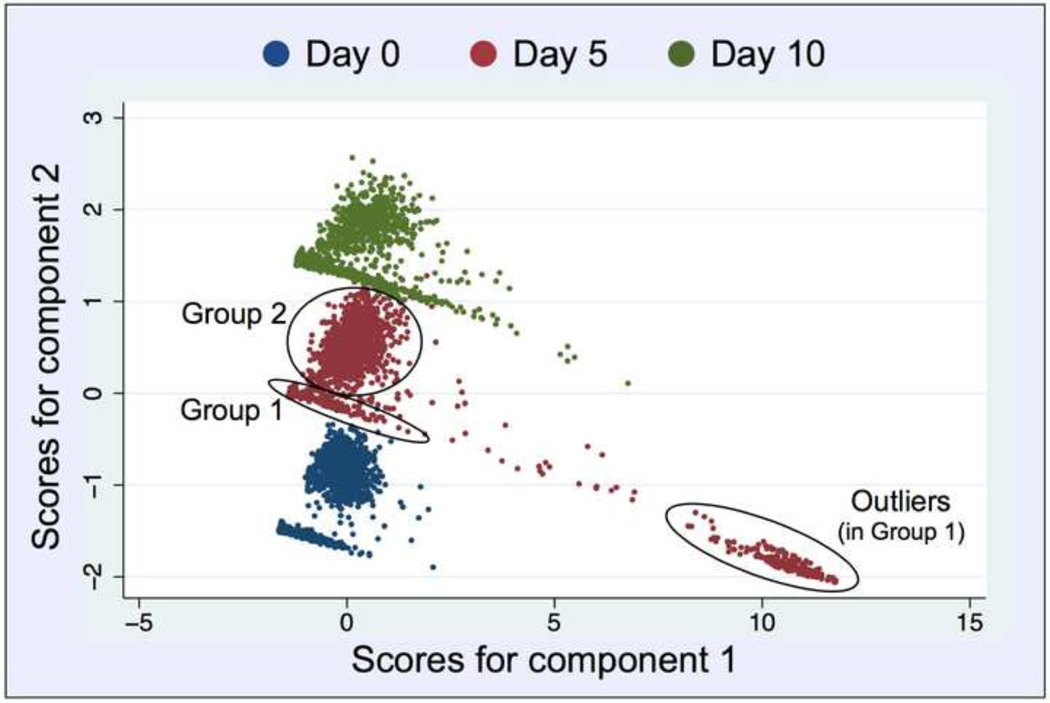
Fig. 5.
Principle Component Analysis (with two components) of the entire data (mean nuclear intensities of the five targets). For each day, the data segregates into two distinct populations (groups) as pointed out by circles for day 1: Group 1 (arm) presumably a mixture of haploid G1-cells and nonviable cells and debris, and Group 2 (cloud) more likely a collection of viable cells in various cell cycle interphases (G1 and S/G2), as judged by their respective DAPI signals (gDNA content) listed in Tables 1 and 2. Each dot corresponds to one object (intended to be a segmented nucleus). On day 5, Group 1 is divided into a main group (arm) and a separate outlier group of objects (arm extension).

