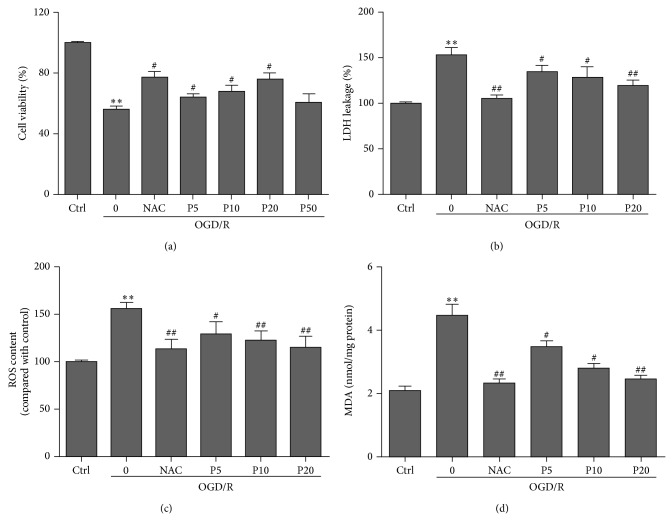
Figure 1.
Protective effects of propofol on OGD/R induced cytotoxicity in H9c2 cells. (a) Cell viability was assessed by measuring the MTT reduction. Propofol (5, 10, 20, and 50 μM) was adopted during the entire ischemia-reperfusion phase. The viability of ctrl group was defined as 100%. (b) Inhibition of OGD/R induced LDH leakage by propofol. The ctrl group was defined as 100%. (c) Effects of propofol (5, 10, and 20 μM) on OGD/R induced increased intracellular ROS contents in H9c2 cells. (d) Effects of propofol (5, 10, and 20 μM) on OGD/R induced increase in the levels of MDA in H9c2 cells. The results were shown as mean ± SEM from three independent experiments. * P < 0.05, ** P < 0.01 versus control, # P < 0.05, ## P < 0.01 versus OGD/R treated group without drugs.

