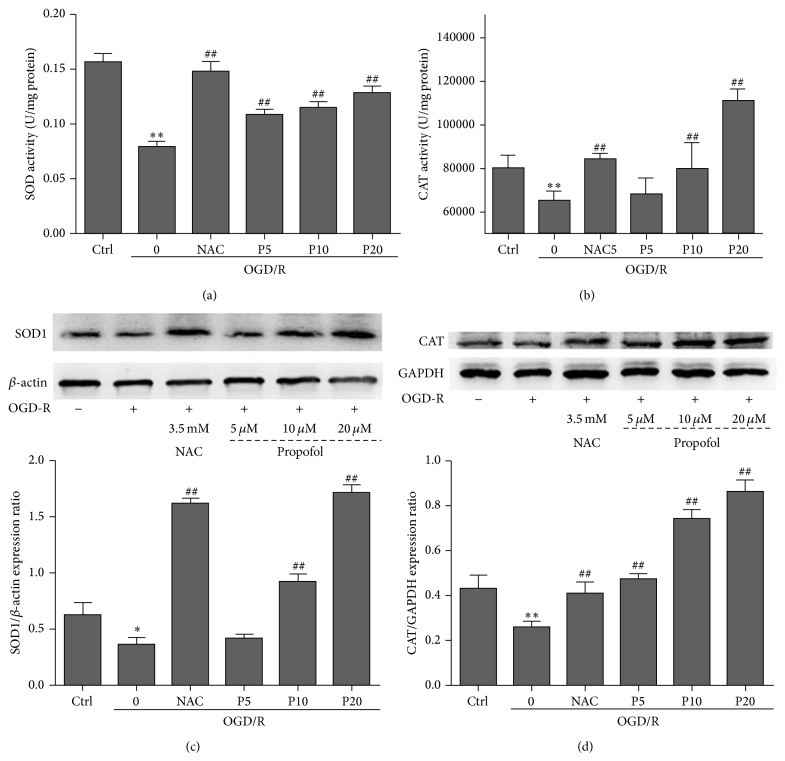
Figure 2.
Enzymatic activity of SOD activity (a), CAT activity (b) and western blotting of SOD1 expression (c), and CAT expression (d) in H9c2 cells. For detecting protein expression, cells were treated with propofol (5, 10, and 20 μM) and subjected to western blotting using specific antibodies. Cells were exposed to OGD/R for 24 h-24 h and harvested in lysis buffer to detect the enzymatic activity. Data were expressed as mean ± SEM from experiments performed in triplicate. * P < 0.05, ** P < 0.01 versus control, # P < 0.05, ## P < 0.01 versus OGD/R treated group without drugs.

