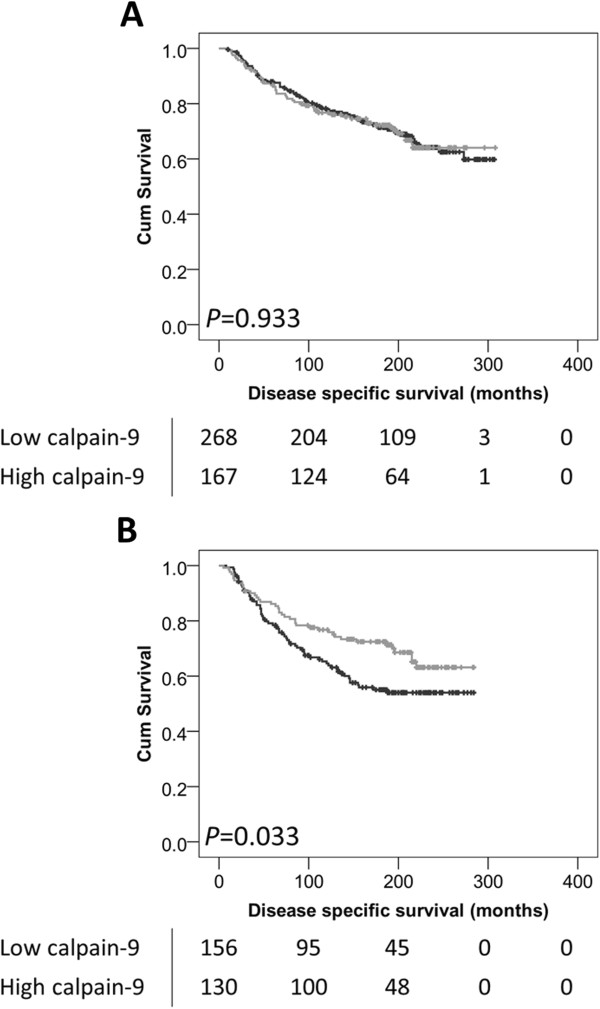
Figure 3.

Kaplan-Meier analysis of breast cancer specific survival showing the impact of low (black line) and high (grey line) calpain-9 expression in patients that did not receive endocrine therapy (A), and in those that did receive endocrine therapy (B); with significance determined using the log-rank test. The numbers shown below the Kaplan-Meier survival curves are the number of patients at risk at the specified month.
