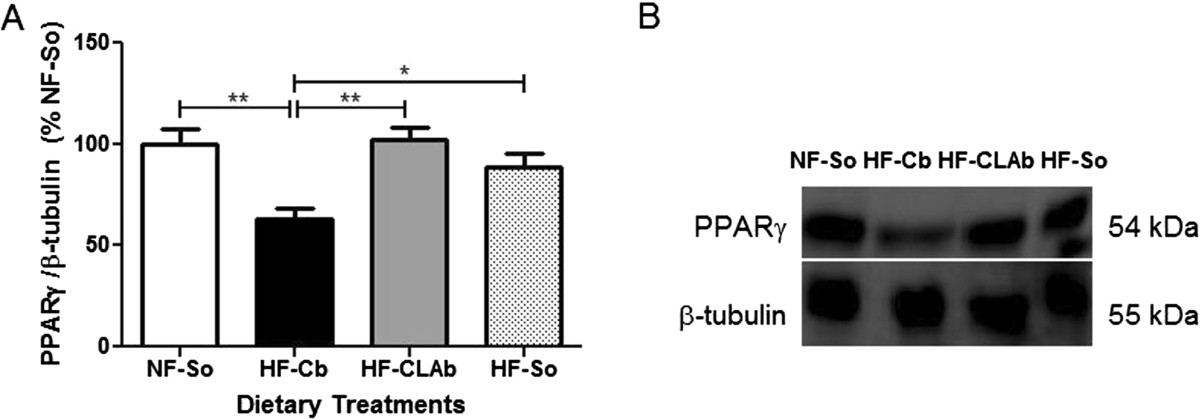
Figure 2.

Analysis of PPARγ protein level in retroperitoneal adipose tissue. PPARγ levels (A) and representative blot for PPARγ and β-tubulin (loading control) (additional Electrophoretic blot files show this in more detail [see Additional files 1, 2, 3 and 4]) (B) of male Wistar rats fed the following dietary treatments for 60 days: Normal fat-Soybean oil (NF-So): diet containing 4.0% soybean oil (SO); High Fat-Control Butter (HF-Cb): diet containing 21.7% control butter and 2.3% SO; High Fat-CLA enriched Butter (HF-CLAb): diet containing 21.7% cis-9, trans-11 CLA-enriched butter and 2.3% SO; High fat-Soybean oil (HF-So): diet containing 24.0% SO. All data are presented as mean values ± S.E.M (n = 10 rats/group). Statistically significant differences were determined by Anova followed by Newman-Keuls. *p <0.05, **p <0.01.
