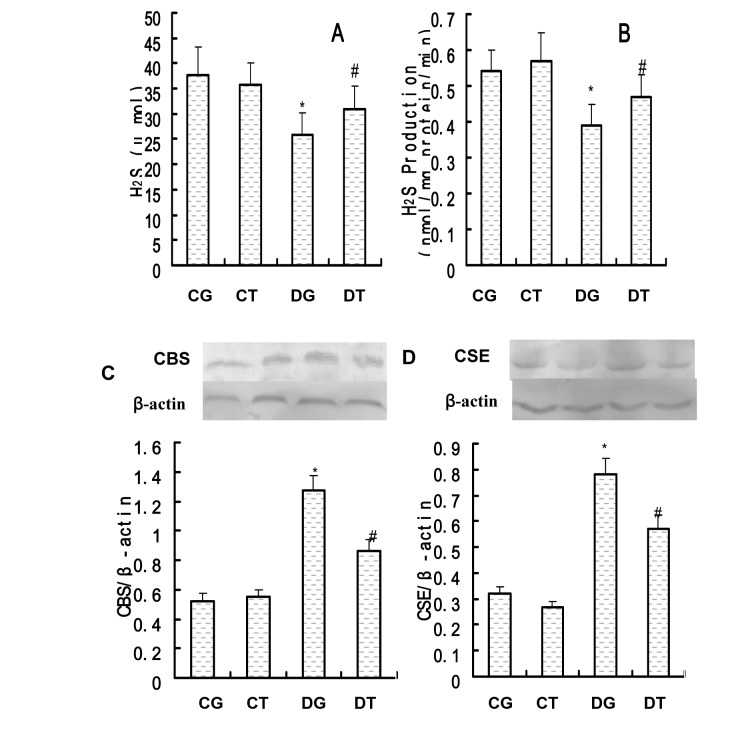
Figure 3.
Effects of ginkgolide B on hydrogen sulfide (H2S) content in plasma, H2S production and cystathionine β synthetase (CBS) and cystathionine γ lyase (CSE) protein expression in the artery. (A) H2S plasma levels; (B) H2S production (C) Representative Western blots (upper panel) and quantitative analysis (lower panel) for CBS; (D) Representative Western blots (upper panel) and quantitative analysis (lower panel) for CSE. CG – control group; CT – control treated group; DG – diabetic group; DT – diabetic treated group. Results are expressed as mean ± standard error of the mean. The number of animals per group was 8. *P < 0.05 compared with control group; #P < 0.05 compared with diabetic group.

