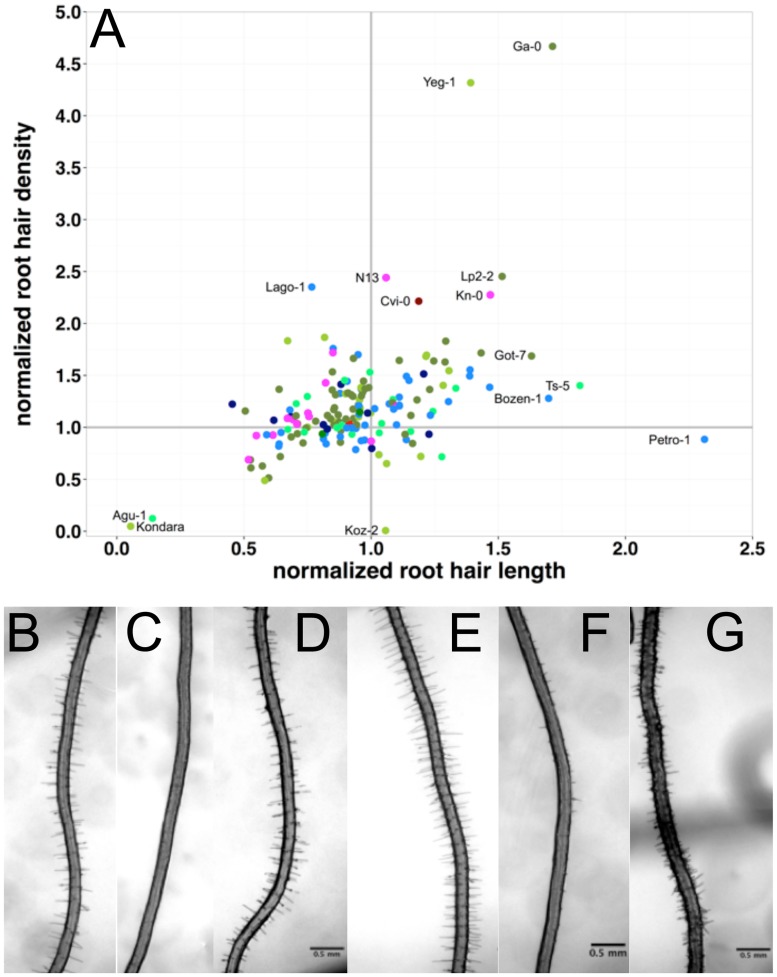
Fig 4. Root hair density and length responses to scarce local phosphorus (P) supply.
The responses were normalized to the density and length under control conditions (+P) and are given as relative values under—P (values of 1 indicate no change). (A) Root hair density response (density-P / density +P) versus relative length (length-P / length +P). (B-G) root hair phenotypes of Kondara (B,C), Col-0 (D,E) and Ga-0 (F,G) under control and local scarce P. Scaling bars: 0.5 mm.

