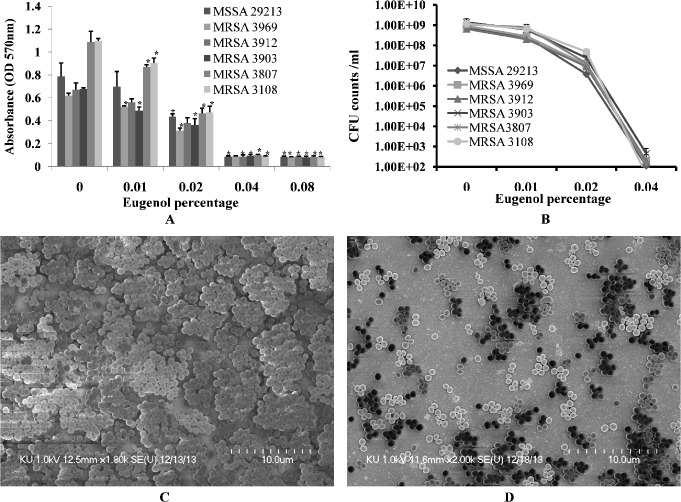
Fig 2. Inhibition of MRSA and MSSA biofilm growth in vitro with different concentrations of eugenol.
(A) Decreased biofilm biomass detected using the microtiter plate assay. (B) Decreased cell viability within biofilms, detected by cfu counts. The error bars represent standard deviation from the mean value. (C) Representative SEM image of S. aureus (ATCC 29213) biofilm grown without eugenol supplement. (D) Representative SEM image of biofilms grown with 0.5×MIC eugenol. The SEM image scale bar corresponds to 10μm.

