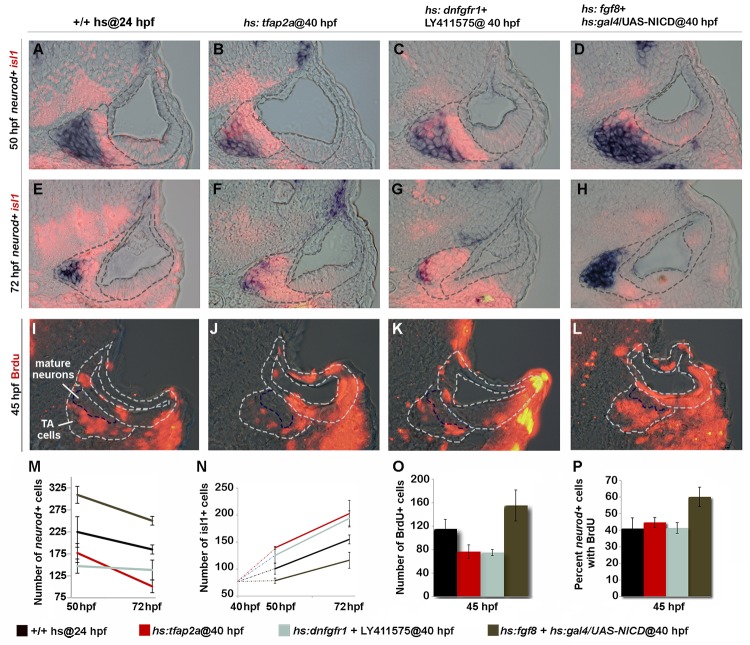
Fig 8. Tfap2a regulates development of TA cells independent of earlier stages.
(A-L) Cross-sections (medial left, dorsal up) at the level of utricular macula. The otic vesicle and regions occupied by mature SAG neurons and TA cells are outlined in each image. Co-staining for Isl1 (red) and neurod (blue) at 50 hpf (A-D) and 72 hpf (E-H) under conditions indicated across the top of the figure. All specimens were treated with 0.3% DMSO and heat-shocked (39°C) at 40 hpf. (I-L) BrdU staining in embryos exposed to BrdU for 5 hours, from 40 to 45 hpf. The region containing mature SAG neurons is indicated. (M-O) Mean and standard deviation for the total number of neurod+ TA cells (M), total Isl1+ mature neurons (N) and total BrdU+ TA cells (O) for the indicated genotypes and treatments (counted from serial sections, n = 3–6 ears per time point). Differences between control and experimental specimens were significant at all time points, except that hs:fgf8+hs:gal4/UAS-NICD embryos were not significantly different from control embryos at 72 hpf in (N). (P) Percentage of neurod+ TA cells that are also BrdU positive (counted from serial sections, n = 3–6 ears per time point). Only hs:fgf8+hs:gal4/UAS-NICD embryos were significantly different from the control in (P).

