Figure 2.
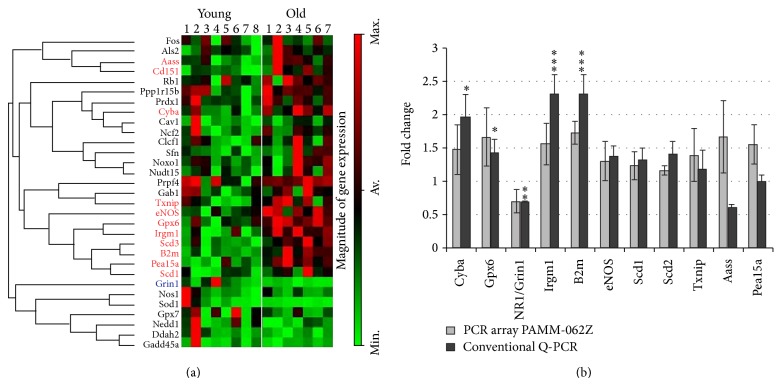
Gene array analysis of striatal transcriptome in young and old mice. (a) Cluster diagram analysis of 31 selected genes expressed in young (n = 8) and old (n = 7) mice. Separation of all samples into 2 age groups was automatically done by the analysis program for only these 31 out of 84 genes included in the PAMM-062Z array. The groups of genes connected by lines on the left of the cluster diagram can be considered coregulated genes. Names of genes whose expression significantly increased with age are written in red. Note an increased expression of genes known to be involved in the immune response (B2m, Irgm1) and oxidative stress (Scd1, Txnip, Gpx6, and Cyba). (b) Validation of gene array data with conventional RT-PCR (primers are given in Supplementary Table 2). Note that significant alterations in the relative mRNA levels for eNOS, Txnip, Aass, and Pea15a revealed by gene array were not confirmed by RT-PCR, whereas transcriptional downregulation with aging for the NMDA receptor NR1 subunit (Grin1) was detected by both assays.

