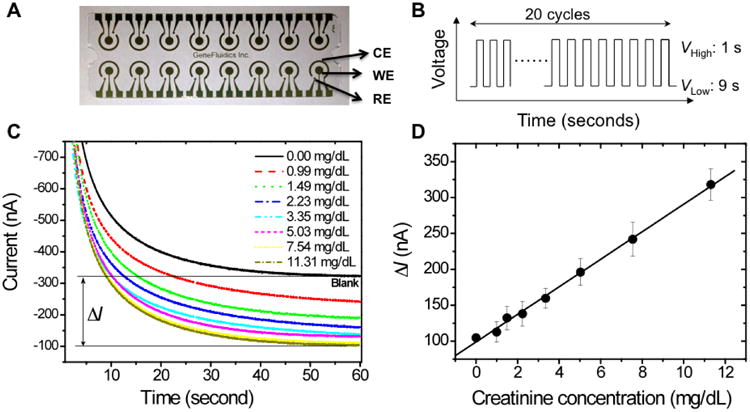
Figure 2.

Electrochemical sensor array for the creatinine measurements and the calibration curves. (A) 16-array bare gold sensor chip with counter electrode (CE), working electrode (WE) and reference electrode (RE). (B) Cyclic square-wave electric potential applied during the polymerization and the reaction. For EC polymerization, the low voltage was + 350 mV and the high voltage was +950 mV. For the surface recognition, the low voltage was -200 mV and the high voltage was +300 mV. (C) Amperometric curves of the spiked creatine into blood sample. Current signal for calibration is the difference between the sample signal and the blank control signal. (D) sensitivity of the EC sensor for creatinine detection of blood samples with linear fit (R2=0.98). The linear fitting equation is ΔI (nA) =98.98+19.17×creatinine concentration (mg/dL). Mean value and standard deviation are both illustrated with triplet experiments.
