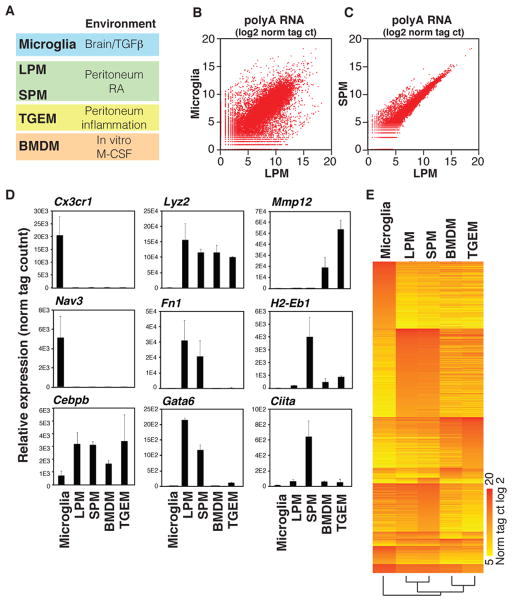
Figure 1. Variation in gene expression in different macrophage subsets.
A. Macrophage subsets used for analysis and corresponding environmental factors (See Figure S1A, B for sorting protocols). B, C. Scatterplots illustrating relative gene expression of polyA-selected RNA transcripts in MG compared to LPMs (B), and SPMs compared to LPMs (C) Values are log2 of tag counts normalized to 107 uniquely mapped tags. See Figure S1C for representative replicate. D. Relative gene expression values (mean ±S.D.) for the indicated genes are shown from replicate RNA-Seq experiments. E. Heat map of transcripts exhibiting an expression value of at least 64 normalized tags in at least one subset, and differing in expression by at least 16-fold in at least one other of the indicated subsets. See also Table S1.

