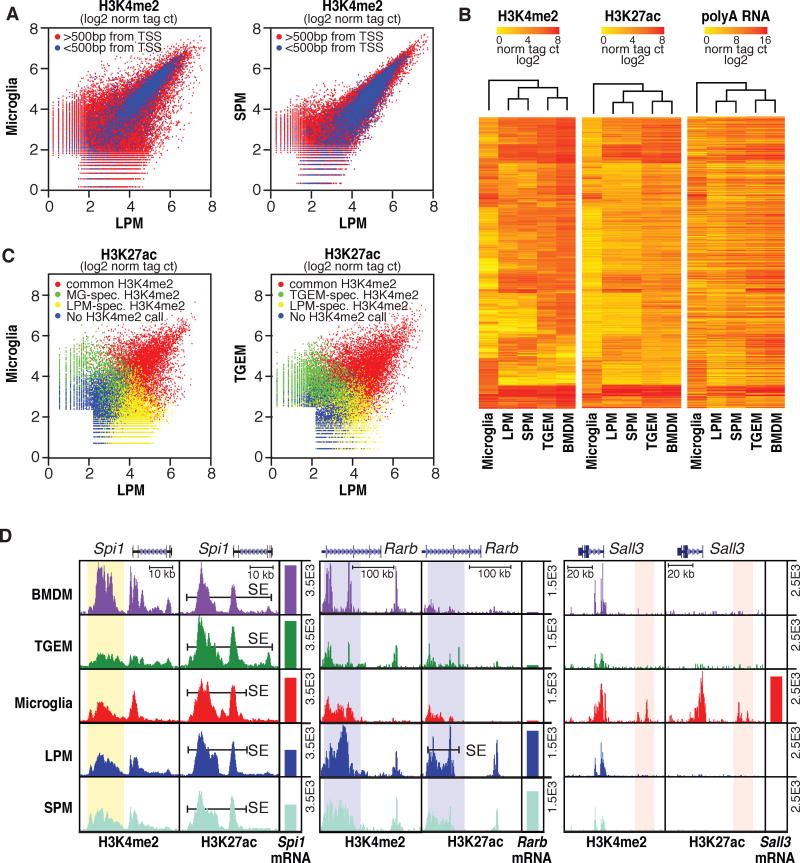
Figure 2. Variation in enhancer landscapes in different macrophage subsets.
A. Scatterplots of normalized H3K4me2 tag counts at genomic regions marked by significant H3K4me2 tags (>32 tags, 0.1% FDR) in LPMs and/or MG (left) or LPMs and/or SPMs (right). Points colored in blue are within 500 bp of a TSS. See Figure S2 for representative replicates. B. Heatmaps of normalized H3K4me2, H3K27ac and nearest expressed gene RNA-Seq tag counts at genomic locations showing >4-fold pairwise differences in H3K4me2 tag counts between at least two of the five macrophage subtypes. Row order is the same for all three data types. C. Scatterplots of normalized H3K27ac tag counts at genomic regions marked by significant H3K27ac tags (>32 tags, 0.1% FDR) in LPMs and/or MG (left) or LPMs and/or SPMs (right). Points are colored red if genomic locations are also marked by H3K4me2 (>16tags) in both subsets, green if marked by H3K4me2 selectively in MG (left) or SPMs (right), yellow if marked by H3K4me2 selectively in LPMs, or blue if not associated with H3K4me2 in either subset. D. UCSC browser images of selected genomic regions with corresponding RNA-Seq data plotted as bar graphs. Bars labeled SE indicate super enhancers and vertical highlights designate regions of interest for subset-common (Spi1) or subset-specific (Rarb and Sall3) loci. All data are normalized to input and library dimension. See also Tables S2–4.

