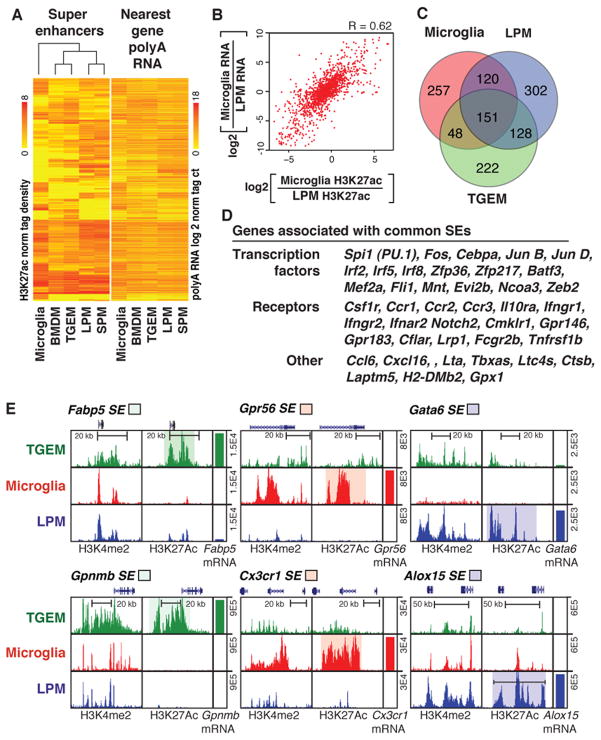
Figure 3. Variation in super enhancer landscapes in different macrophage subsets.
A. Heat maps of H3K27ac tag densities at super enhancers and RNA-Seq tag densities at nearest expressed genes. Rows are ordered the same for both plots. B. Scatter plot of the relationship between ratio of MG to LPMs H3K27ac tag density at super enhancers (x-axis) and the ratio of nearest gene expression (y-axis). C. Venn diagram indicating overlap and specificity of super enhancers in MG, LPMs and TGEMs. D. Examples of genes associated with common super enhancers. E. UCSC genome browser images of selected subset-specific super enhancers and associated genes with subsets-specific regions of interest highlighted.

