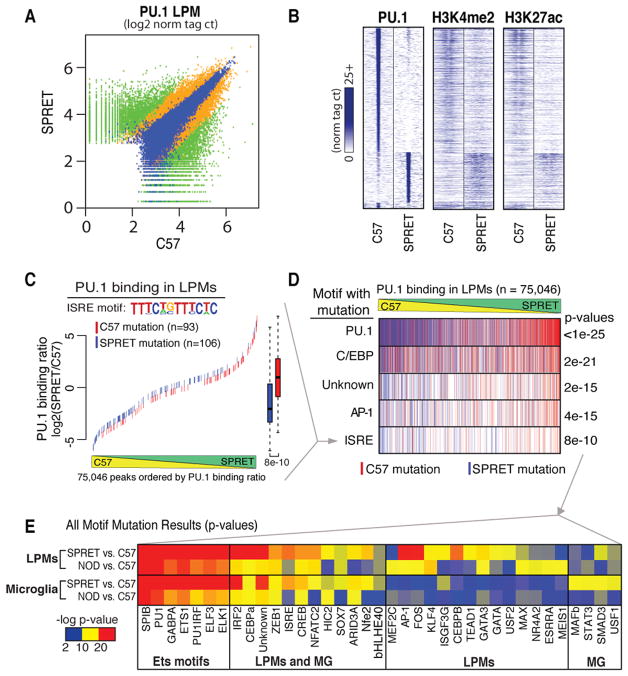
Figure 5. Motif mutations in potential PU.1 collaborating transcription factors confirm cooperative binding for subset-common and subset-specific factor combinations.
A. PU.1 binding between SPRET and C57 is shown at for 200 bp regions where green signifies differential binding (>4 fold, p<1E-4, n = 13,199), blue similar binding (<4 fold, p<1E-4, n = 11,022) and orange in between (n = 12,367). B. Heatmap of 2 kb differentially-bound PU.1 genomic regions (rows) centered on PU.1 binding for ChIP-Seq tags of PU.1, H3K4me2 and H3K27ac between C57 and SPRET (columns). C. An example of motif mutation analysis is shown for the ISRE motif. 200 bp genomic sequence at all PU.1 bound loci (in A) were queried for genetic variants that mutated the ISRE motif matrix in either C57 or SPRET. Mutations were colored according to the genome mutated; red = C57, blue = SPRET. ISRE mutations were plotted according to the PU.1 binding strain ratio (y-axis) as measured in LPMs at that locus and rank-ordered on the x-axis. Boxplots of corresponding color indicate the effect of ISRE motif mutations on PU.1 binding where whiskers extend to data extremes and p-value are from two-sided t-test. D. Results from analyses described in C are vertically compressed and shown in rows for PU.1, C/EBP, Unknown, AP-1, and ISRE motif mutation events. E. Heatmap showing p-values resulting from analysis described in C and D for motif mutations best matching transcription factors indicated on x axis. Each motif was tested for affecting PU.1 binding between C57 and NOD and between C57 and SPRET both in MG and LPMs (y-axis). See also Figure S3 and Tables S5 and S6.

