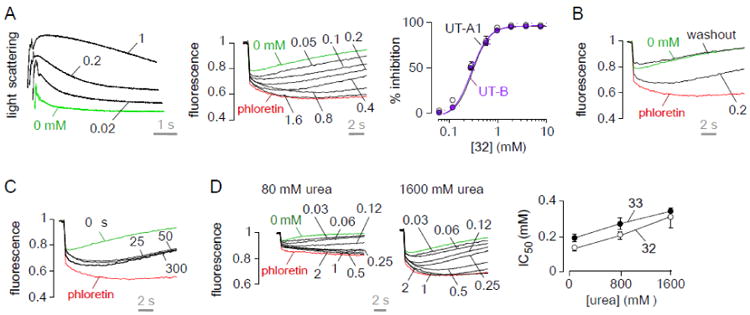
Figure 4. Characterization of 32.

A. Inhibition of rat UT-B urea transport measured in erythrocytes by stopped-flow light scattering (left). UT-A1 concentration-inhibition curves (middle panel). Concentration-inhibition of rat UT-A1 and UT-B (right) (mean ± S.E., n = 3). B. Reversibility. Compounds were incubated (at 0.2 mM) with the triple transfected MDCK cells for 15 min, then washed twice and subjected to UT-A1 inhibition assay. C. Kinetics of UT-A1 inhibition. UT-A1 urea transport measured at different times after addition of 0.2 mM of 32. D. Concentration-inhibition data for 32 and 33 using 80 and 1600-mM urea gradients (left). IC50 as a function of urea gradient (right).
