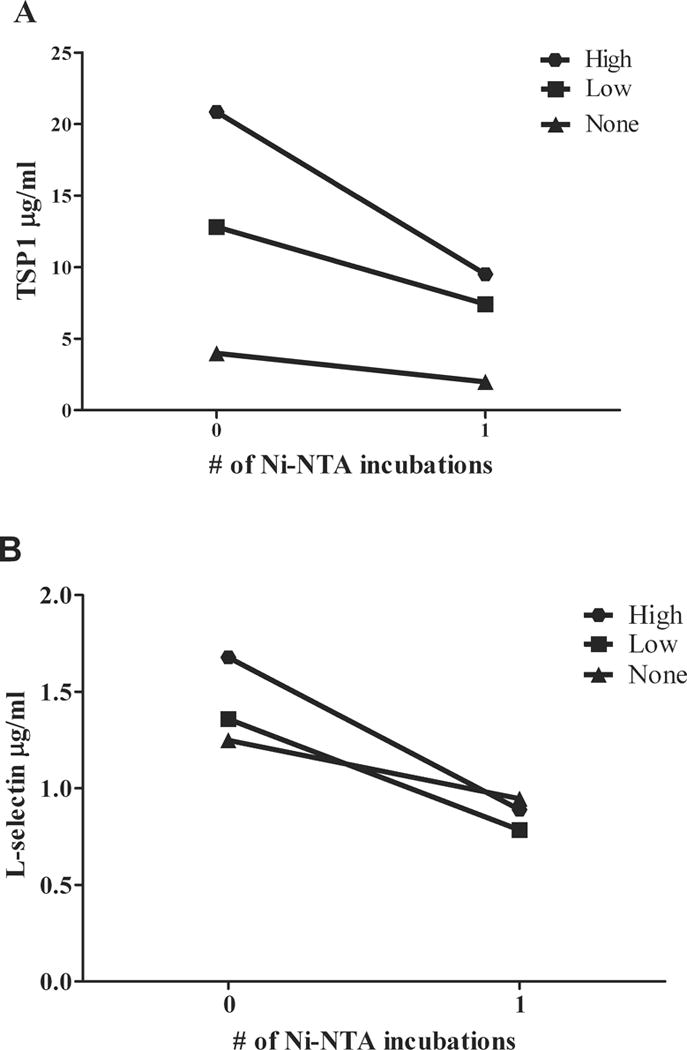
Figure 2.

Ni-NTA decreased plasma concentrations of TSP1 (A) and L-selectin (B). A. Average plasma TSP1concentrations before and after depletion were 20.8 and 10.6 μg/mL for patients with high hemolysis (n=3), 12.8 and 8.3 μg/mL for low hemolysis (n=3) and 4.0 and 2.3 μg/mL for no hemolysis (n=2), respectively. B. Average Plasma L-selectin concentrations before and after depletion were 1.7 and 1.0 μg/mL for patients with high hemolysis (n=3), 1.4 and 1.1 μg/mL for low hemolysis (n=3) and 1.2 and 1.1 μg/mL for no hemolysis, respectively (n=2).
