
Figure 2.
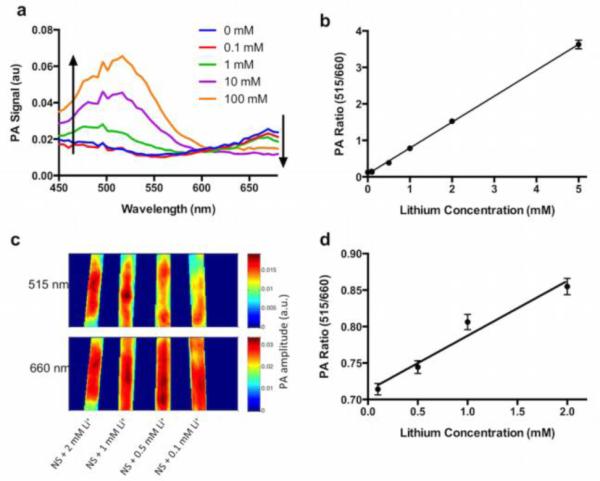
Responses of photoacoustic nanosensors to lithium within physiological ranges. The photoacoustic spectrum (a) has two peaks centered at 515 and 660 nm. The 515 peak increases with lithium concentrations, and the 660 peak decreases. In vitro measurement of this ratio (b) responds to lithium and is insensitive to common confounding factors such as concentration of nanosensors. Photoacoustic imaging of nanosensors under a 1.5 mm thick layer of chicken tissue (c) shows signal attenuation of the 515 nm peak, while retaining the ratiometric lithium response (d). PA: photoacoustics.