
Figure 3.
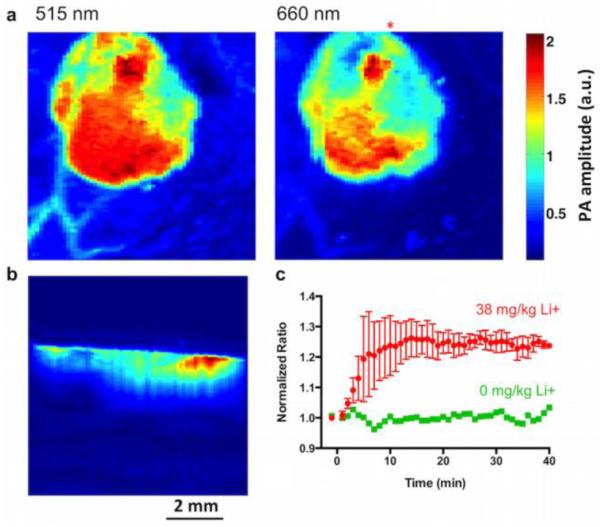
Photoacoustic nanosensors imaged in a small animal model. Dual wavelength images of the nanosensor injection using photoacoustic tomography (a) clearly show the boundary of the injection. A depth profile (b) taken along the line below the red asterisk in (a) shows the nanosensor injection in the tissue. The response of nanosensors to systemic lithium administration (c) for three animals yields a time to maximum lithium of 14 minutes (lithium n=3, vehicle n=1).