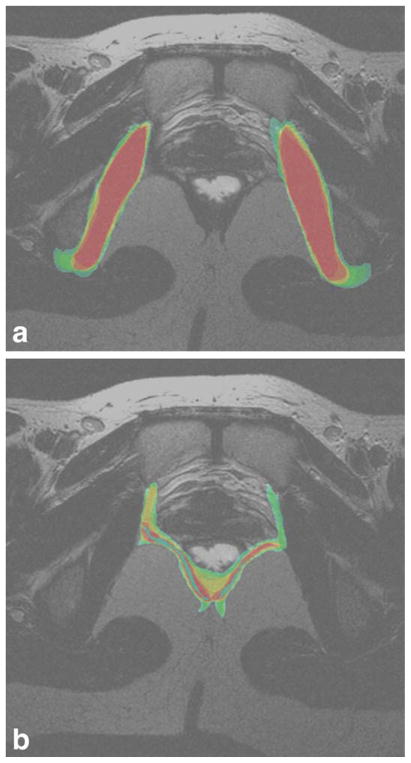
Figure 4.
a,b: The distribution of average overlap is given in Figure 3a for a structure with high agreement (the obturator internus), and Figure 3b for a structure with low agreement (levator ani). In these figures, areas in red indicate areas of complete agreement among all nine segmentations for that slice. Orange indicates a region of less agreement, with decreasing agreement in the order yellow, green, and blue, which indicates the least agreement.

