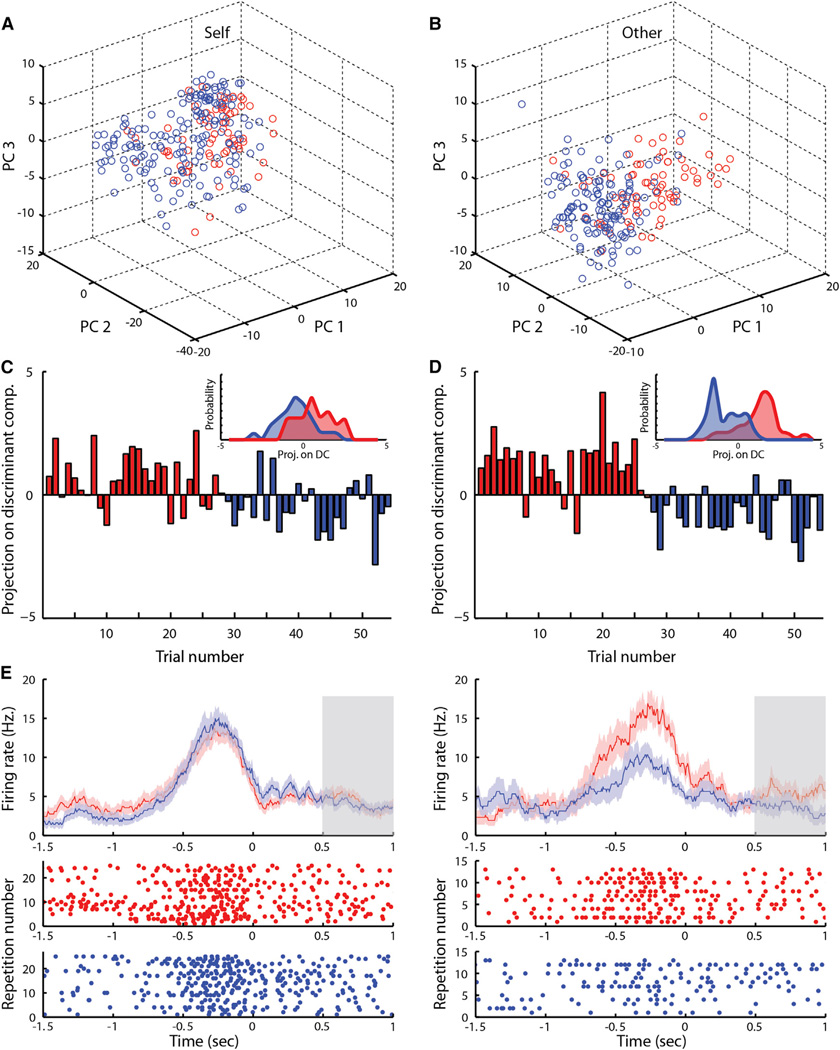
Figure 5. Trial-by-Trial Population Prediction of the Other’s Yet Unknown Decision.
(A and B) Principal component (PC) analysis over a sample session. Plotted in first three PC space, each circle represents the activity of all neurons recorded simultaneously on a single cooperation (red) or defection (blue) trial (see Supplemental Information).
(A) Self-current pre-decision activity.
(B) Other’s-concurrent (yet unknown) post-decision activity.
(C and D) Linear decoding model. Each bar represents projection of the activity of all simultaneously recorded neurons during a single trial on first discriminant component (color code above). Positive values predict cooperation and negative defection. Insets (top right) plot distribution of projection values for cooperation (red) and defection (blue).
(C) Self-current pre-selection projection.
(D) Other’s-concurrent projection during post-selection.
(E) Peristimulus histograms as mean firing activity ± SEM (top) and raster plots of a neuron encoding the monkey’s own current decision during the pre-selection period and modulated by the other’s past decision. Trials separated according to monkey’s own current decision to defect (left) or cooperate (right) and opponent’s decision on a preceding trial to cooperate (red) or defect (blue; see text). Time zero denotes monkey’s own selection. Gray bar indicates feedback period.

