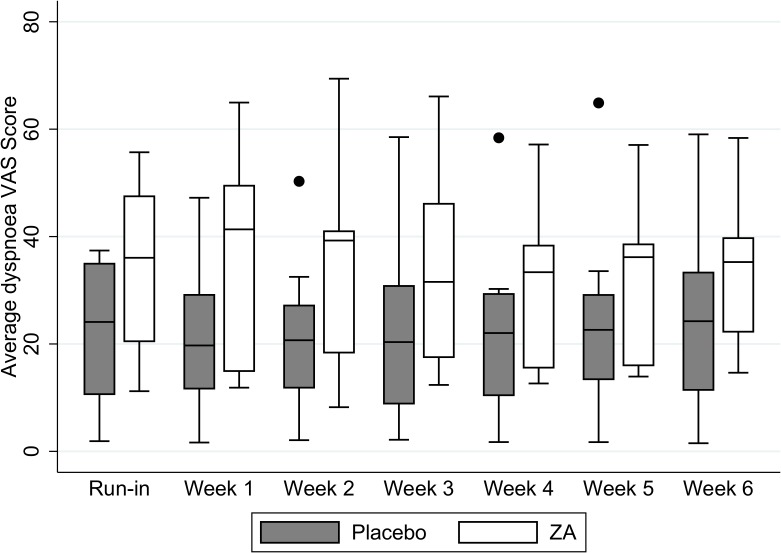
Fig 2. Box and whisper plot evaluating the average weekly VAS breathlessness scores for the 2 treatment arms.
The horizontal line with the box represents the median. The box edges represent the lower (25th) and upper (75th) quartiles. The whiskers represent the lower and upper adjacent values. Outside values are plotted separately.

