Figure 4.

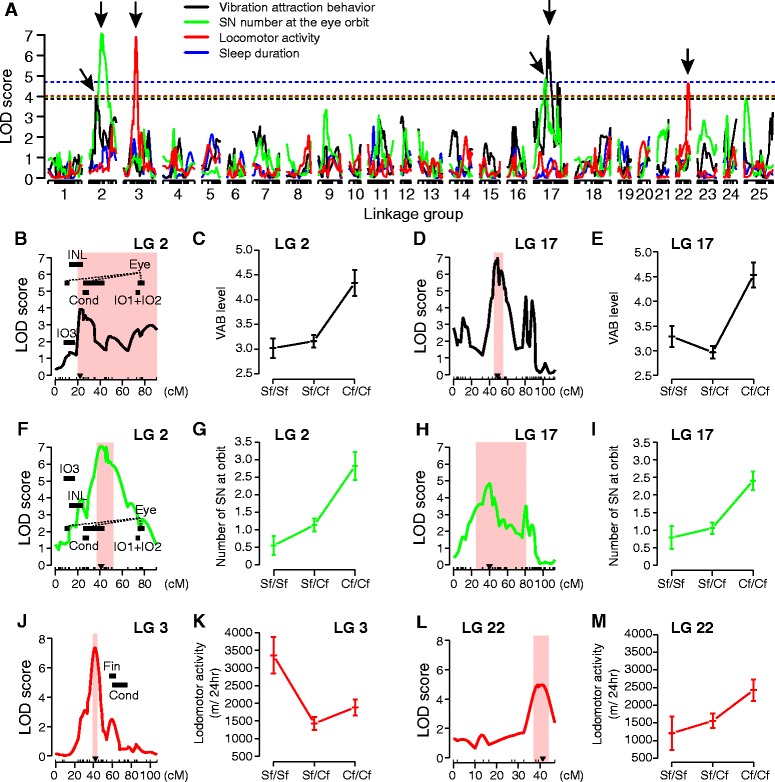
QTL reveals distinct genetic architectures controlling VAB and sleep. (A) Logarithm of the odds (LOD) scores computed with single-QTL model genome-scan are plotted against the distance across each linkage group (LG). Black solid lines indicate LOD scores for VAB-level, green lines for SN number at the eye orbit, red lines for locomotor activity, and blue lines for sleep duration. Significant QTL for VAB and SN number at the orbit were detected at LG 2 and 17. Significant locomotor activity-QTL was detected at LG 3 and 22 following multiple QTL mapping. The horizontal dotted lines indicate the genome-wide significance thresholds at P <0.05. Arrows indicate the peaks of the significant QTL. (B-E) LOD scores for VAB at LG 2 (B) and LG 17 (D). The X-axis indicates genetic distance in centimorgans (cM), and red colored shades denote Bayesian credible intervals with probability coverage as 0.95 for each significant QTL. Effect plots of phenotypic values of VAB against each genotype (mean ± s.e.m.) at the peak locus denoted by the black triangle in (B) and (D) are shown in (C) and (E), respectively. (F-I) LOD scores for the number of superficial neuromasts (SN) at LG 2 (F) and LG 17 (H), and effect plots of phenotypic values of SN number against each genotype at LG 2 (G) and at LG 17 (I). (J-M) LOD scores for locomotor activity at LG 3 (J) and LG 22 (L), and effect plots of phenotypic values of SN number against each genotype at LG 3 (K) and at LG 22 (M). Black bars in (B), (F) and (J) indicate the reported QTL intervals for relative condition (Cond), eye size (Eye), fin placement (Fin), SO3 width (IO3) [34], thickness of inner nuclear layer (INL, [33]), SO1 and SO2 fusion (IO1 + IO2, [35]. Sf/Sf, surface fish homozygote, Sf/Cf, heterozygote, and Cf/Cf, cavefish homozygote.
