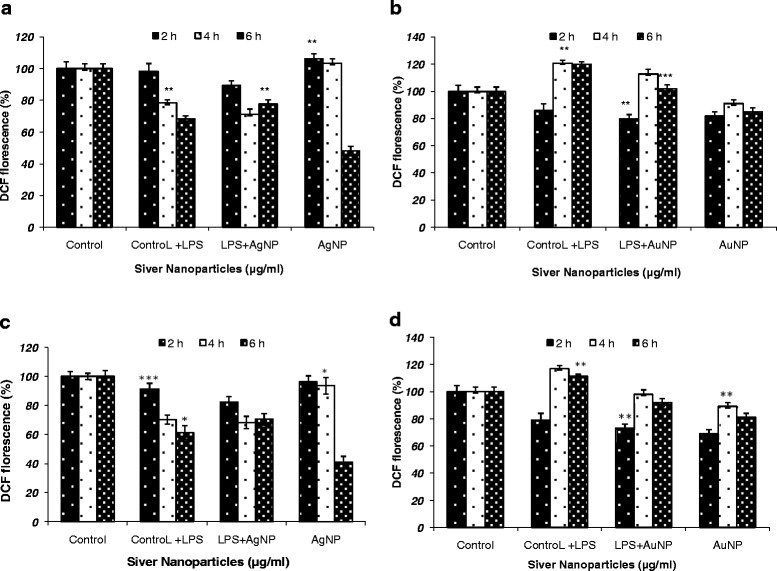
Figure 6.

ROS estimation in J774 cell lines (a and b) and THP1 α cell lines (c and d) after incubation with nanoparticles (1 & 3 AgNPs; (2 & 4) AuNPs at various time points (2 h, 4 h, 6 h). Results are presented in relative units compared with controls. Data represent the mean ± standard deviation of three individual experiments. p < 0.05.
