Figure 4.

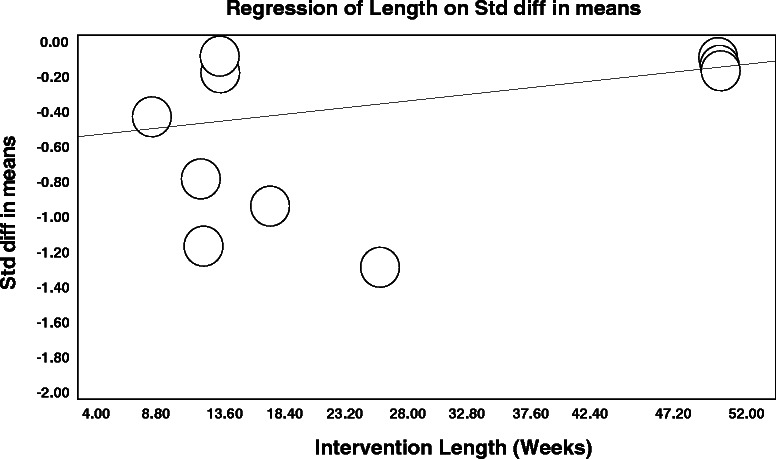
Bubble plot for the dose–response relationship between the intervention length (weeks) and effect estimates changes for CRF from the nine randomized controlled trials included in the meta-regression analysis (P = 0.02).

Bubble plot for the dose–response relationship between the intervention length (weeks) and effect estimates changes for CRF from the nine randomized controlled trials included in the meta-regression analysis (P = 0.02).