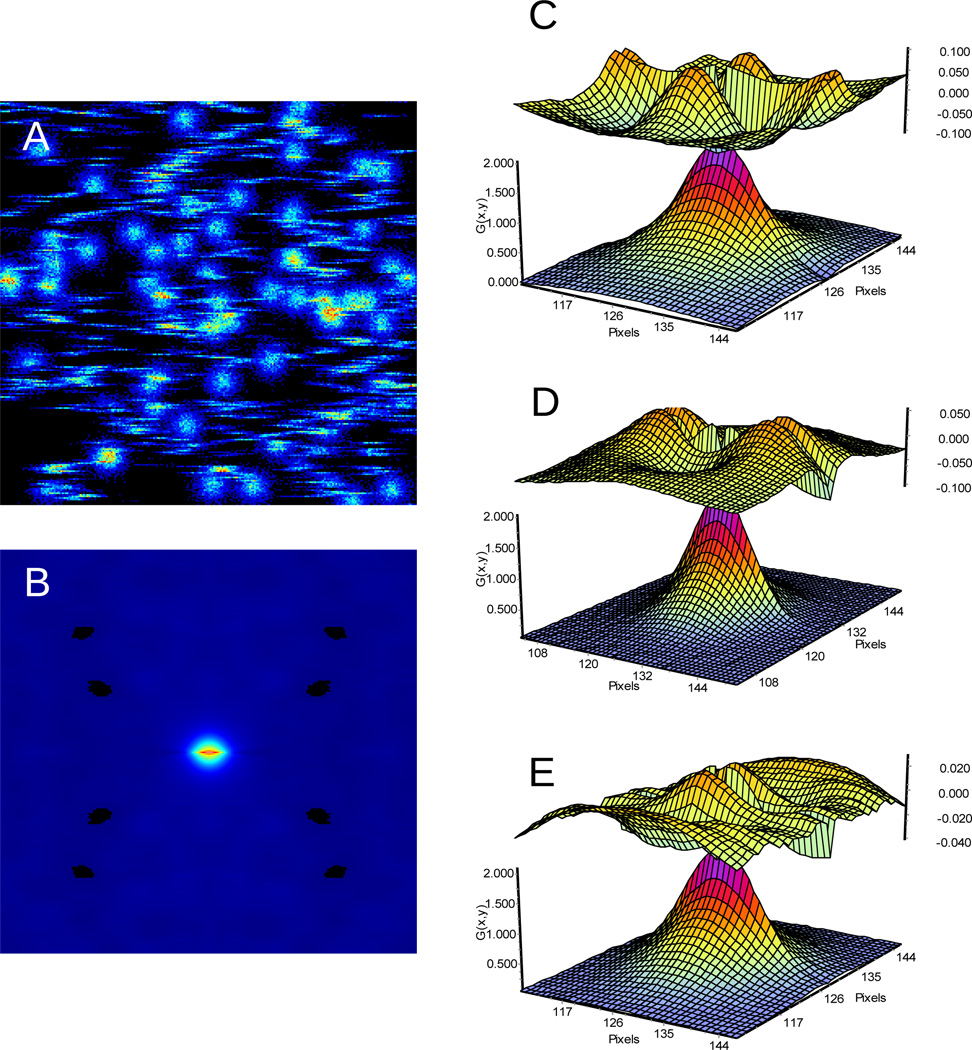
Figure 2.
A) One frame showing the streaks due to the fast diffusing molecules and the round shapes due to the transiently immobile molecules. B) RICS autocorrelation function. C), D) and E are the fit (lower surface) and the residues (upper surface) using the diffusion, binding and diffusion + binding models (respectively). The binding + diffusion model gives the best fit.

