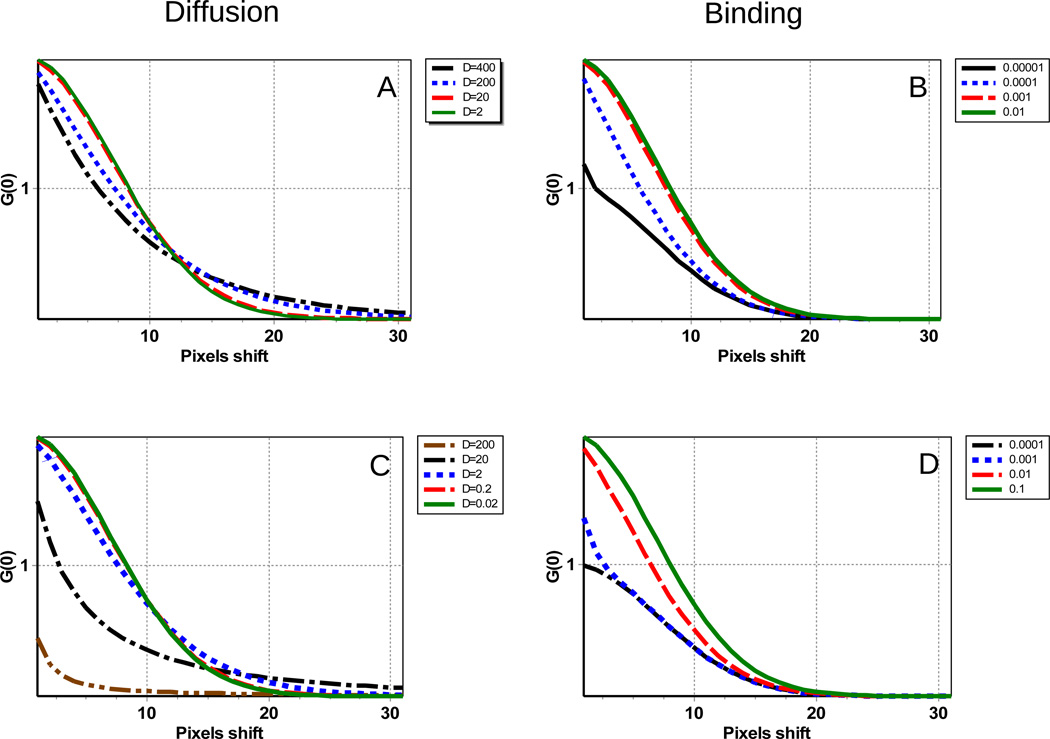
Figure 5.
A) and B) Horizontal and C) and D) vertical sections of the RICS surface for different values of the diffusion coefficient and binding time. A) The diffusion coefficient varied from D=400 to 2µm2/s). B) The binding time varied from 0.00001 to 0.01s. C) The diffusion coefficient varied from D=200 to 0.02µm2/s). D) The binding time varied from 0.0001 to 0.1s

