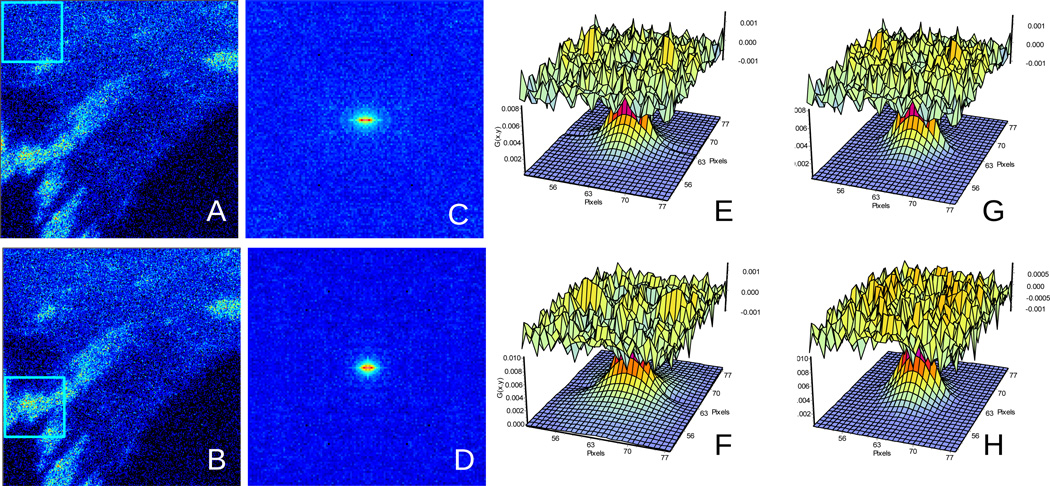
Figure 6.
RICS analysis of a MEF cell1 expressing FAK-EGFP. This cell has regions with few adhesions (A) and regions with many adhesions (B). The corresponding RICS function (C) and (D) and the fits according to the diffusion model (E) and (F) and binding model (G) and (H) are reported in table 3.

