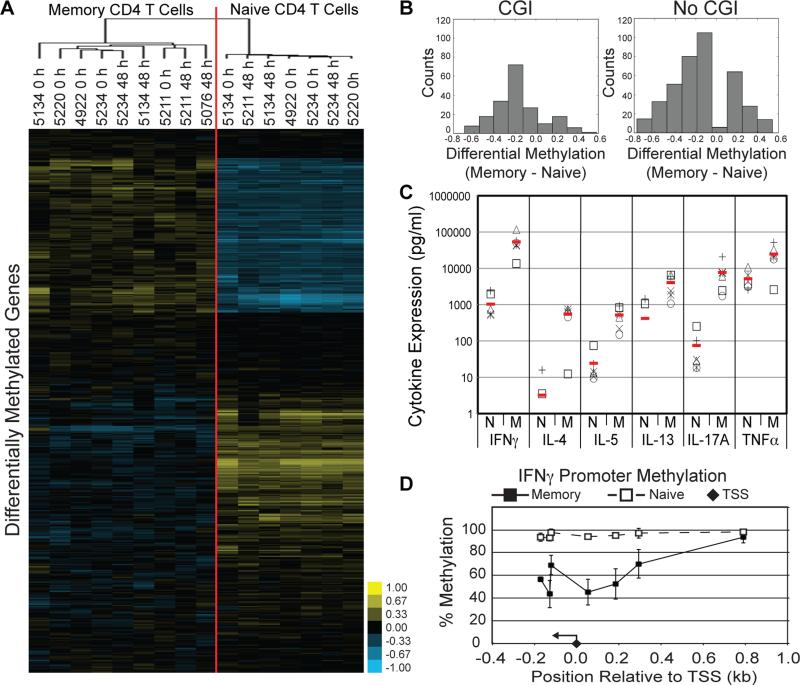
Figure 3.
Analysis of methylation at individual CpGs in CD4 T cells. (A) Hierachical clustering of individual CpG methylation in CD4 T cells. Samples are labeled with cell subset, donor identifier (numerical value), and time point following activation (0 or 48 h). (B) Differential methylation between memory and naïve CD4 T cells. (C) Cytokine expression by naïve and memory cells activated for 48 h. Data are representative of 6 donors (symbols represent different donors, red lines represent average signal). (D) Promoter methylation of IFNγ for naïve (open circles, dashed line) and memory (filled squares, solid line) CD4 T cells. The filled diamond marks the TSS and the arrow indicates directionality of transcription. Data are representative of 2 donors.

