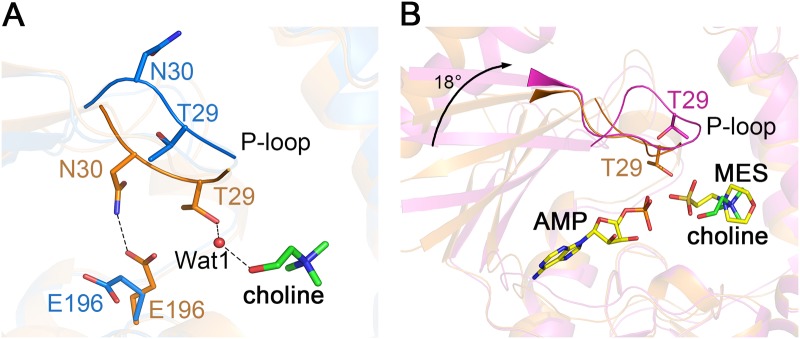
Fig 3. Conformational changes in the active site.

(A) Comparison between apo-LicA (blue) and LicA-choline (orange) with P-loop shown as cartoon. The choline molecule and the interacting residues are shown as sticks. The hydrogen bonds are indicated as dashed lines. (B) Comparison between LicA-choline (orange) and LicA-AMP-MES (magenta). The choline molecule is shown as green sticks while AMP and MES are shown as yellow sticks. The 18° rotation of the N-terminal domain is indicated as black arrow.
