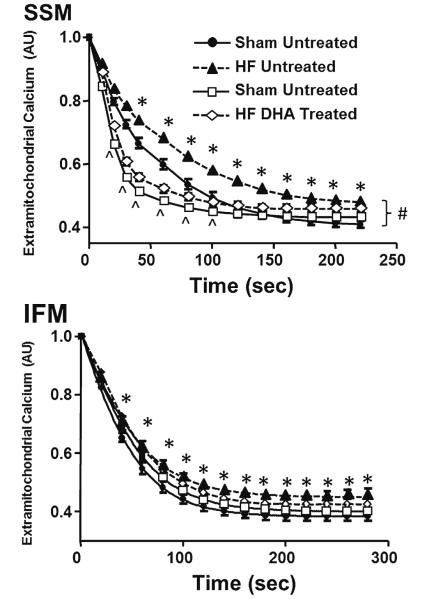
Fig. 6.
Extramitochondrial Ca2+ fluorescence. * P <0.05 heart failure compared to respective sham, # P <0.05 DHA treatment compared to standard diet in heart failure, ^ P <0.05 DHA treatment compared to standard diet in the sham groups. Groups sizes were 15 and 20 for the untreated sham and heart failure groups, respectfully, and 14 and 20 for the DHA treated sham and heart failure groups, respectfully

