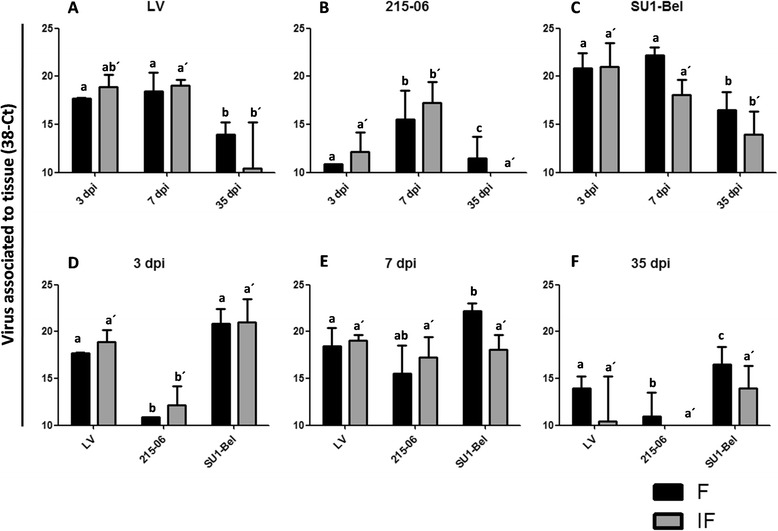
Figure 1.

PRRSV viral load in mediastinal lymph node. PRRSV RNA was quantified by RT-qPCR and data represented by changes in the cycle threshold (Ct) in F and IF areas of Med-LN of LV (A), 215–06 (B) and SU1-Bel (C) infected animals. Differences between distinct PRRSV-1 infected groups are showed for 3 (D), 7 (E), and 35 (F) days post-infection. This figure showed the median of each group ± SD. In control animals the viral RNA were not detected (data not shown). Identical superscript letters indicate no significant difference (p > 0.05), whereas different superscript letters indicate statistically significant differences (p < 0.05) between the same compartment among different groups (a, b, and c for follicle; a´, b´, and c´ for interfollicular area).
