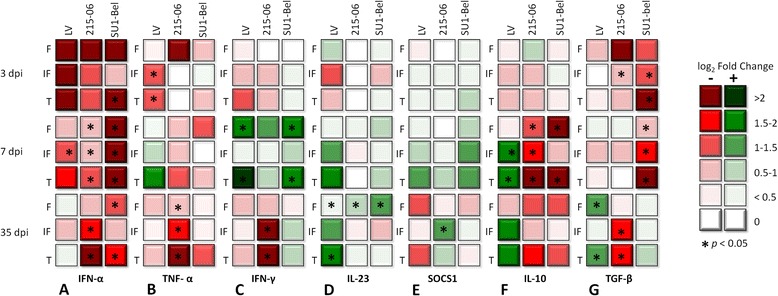
Figure 4.

Cytokine gene expression in mediastinal lymph node compartments. Log 2 Fold change in transcript level of IFN-α (A), TNF-α (B), IFN-γ (C), IL-23p19 (D), SOCS1 (E), IL-10 (F) and TGF-β (G) gene expression relative to the control gene β-Actin; which was calculated by 2-ΔΔCt method. Log2 fold change of gene expression in follicle (F), interfollicular area (IF) or total Med-LN lymph node (T) values are depicted. Green boxes indicate upregulation and red boxes indicate downregulation as the key showed. The statistically significant differences (p < 0.05) with control group are indicated by asterisks on the boxes.
