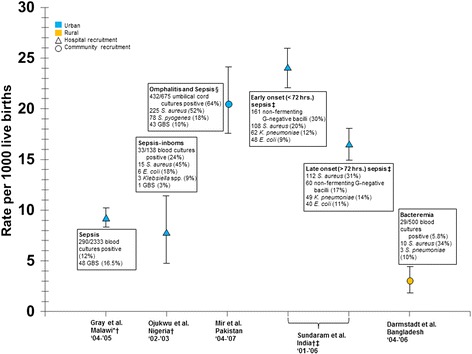
Figure 2.

Incidence and aetiology of neonatal sepsis/bacteremia for 1000 live births in developing countries. Sources; [18,23,27-29] The figure shows point estimates, 95% confidence intervals, and aetiology of neonatal infections along with recruitment strategy and setting. Studies represented in blue were conducted in urban areas. Studies represented in orange were conducted in rural areas. Studies represented by a triangle used hospital recruitment. Studies represented by a circle used community recruitment. GBS (Group B streptococcus). *The Incidence estimate was calculated from the number of isolates and births presented. †CI estimated from data presented in the article. ‡The two estimates were taken from the same study. § Each case had both omphalitis and clinically defined sepsis.
