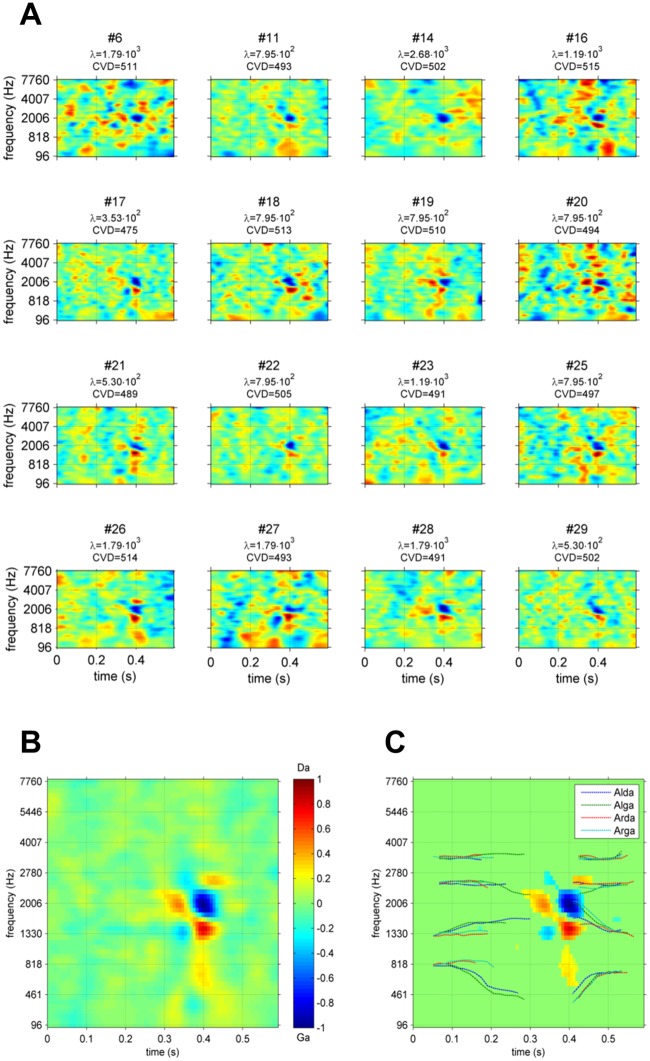
Fig 4. Global ACIs.
A. Individual ACI estimated on 10,000 trials for all 16 participants. and CVD are indicated below each image. B. Mean ACI for the participants collectively (estimated with λ = 1,191). C. Same ACI, with non-significant weights set to 0 (corrected t-test, FDR<0.01) and formant trajectories superimposed. In each ACI, weights are divided by their maximum absolute value.

