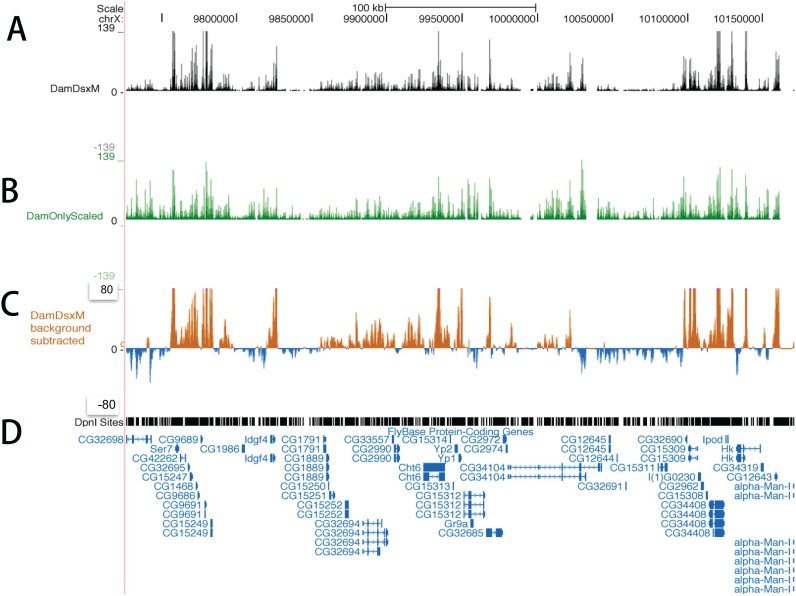
Fig 1. Distribution of uniquely mapped reads on chromosome X of Drosophila melanogaster.
A snapshot of the University of California, Santa Cruz (UCSC) genome browser shows the distribution of the mapped reads after scaling in reads number per million mapped reads. A and B: The mapped reads in the Dam-DsxM/+ and Dam only (control) genotypes, respectively. C: Reads distribution of Dam-DsxM/+ after the control signal subtraction. D: Distribution of the restriction enzyme Dpnl. Below this the annotated genes are displayed.

