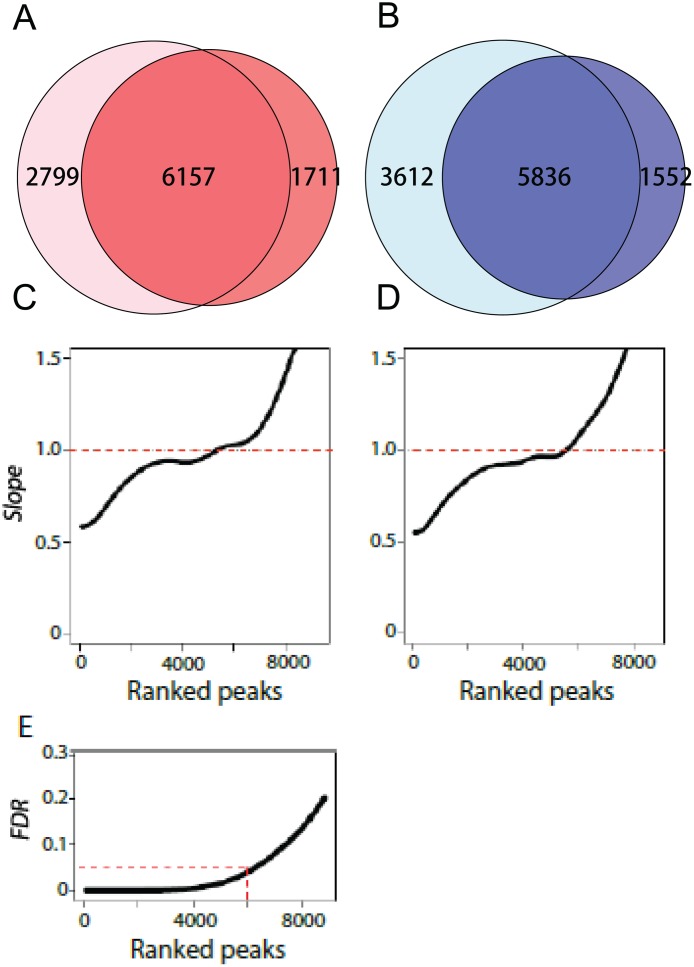
Fig 3. Number of peaks validated by the IDR analysis.
A&B: Using the NPPC algorithm, we identified 6,157 and 5,836 between-replicate shared peaks for DsxF and DsxM, respectively. C&D: IDR analysis between biological replicates in DsxF and DsxM, respectively. According to Li et al. [8], a correspondence curve describes the function between a parameter of top t% ranked peaks and corresponding rank intersection between the two replicates. The slope (y-axis) is the first derivative of the function against the parameter. The slope change from 0 to larger than 0 represents the decay point of inconsistency. E: The relationship between ranked peaks and the overall IDR. Corresponding to the top 6,000 peaks, the IDR is 5%.

