
Figure 2.
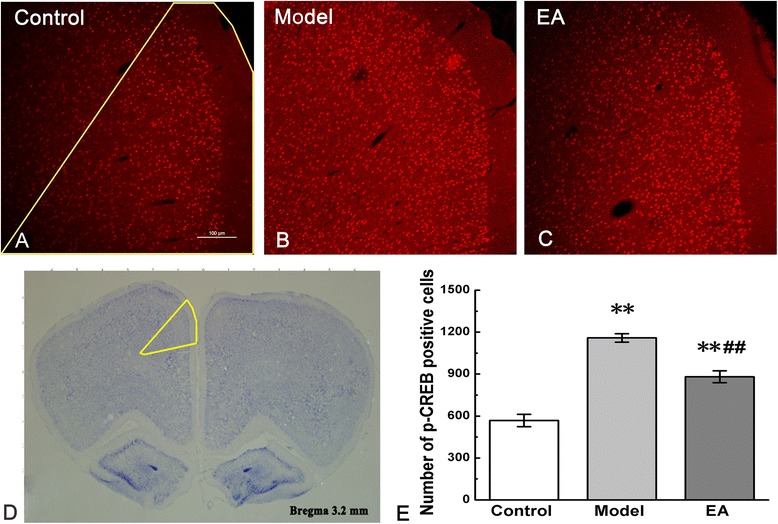
Phosphorylation of CREB in the anterior cingulate cortex (ACC). Differences in p-CREB expressions in control, model, and EA groups were presented in figure a, b, and c. Yellow line in figure a indicated the selected field in which the numbers of p-CREB-positive cells were counted. The left ACC in the harvested brain cortex was circled with a yellow line in figure d. Quantification of p-CREB positive cells was shown in figure e. Error bars indicated standard error of the mean. Three rats for each group, five slides for each rat. ** p < 0.01, vs. the control group; ## p < 0.01, vs. the model group.