
Figure 3.
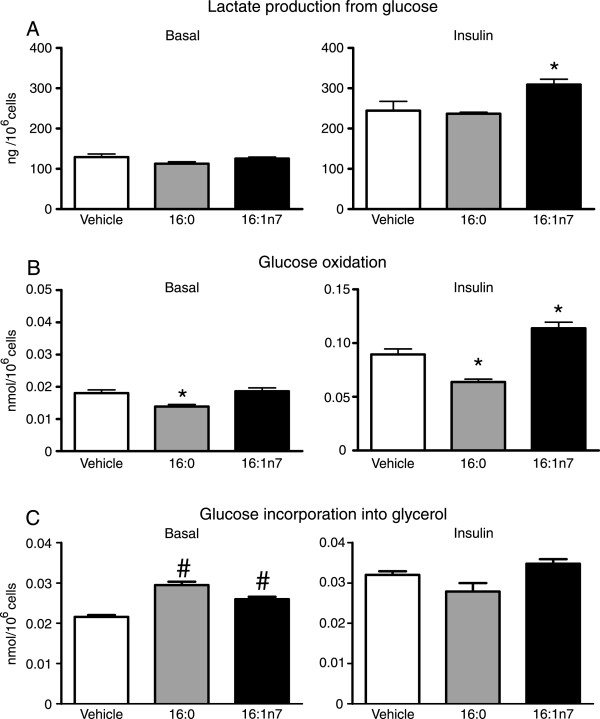
Basal and insulin-stimulated rates of glucose conversion into lactate (Panel A), glucose oxidation (Panel B) and glucose incorporation into glycerol fraction of triacylglycerol (Panel C), in differentiated 3 T3-L1 cells treated for 24 h with either vehicle, palmitic acid (16:0, 200 μM) or palmitoleic acid (16:1n7, 200 μM). Results are means ± SE ( n = 6-10/group). *P < 0.05 vs. all groups and #P < 0.05 vs. vehicle.