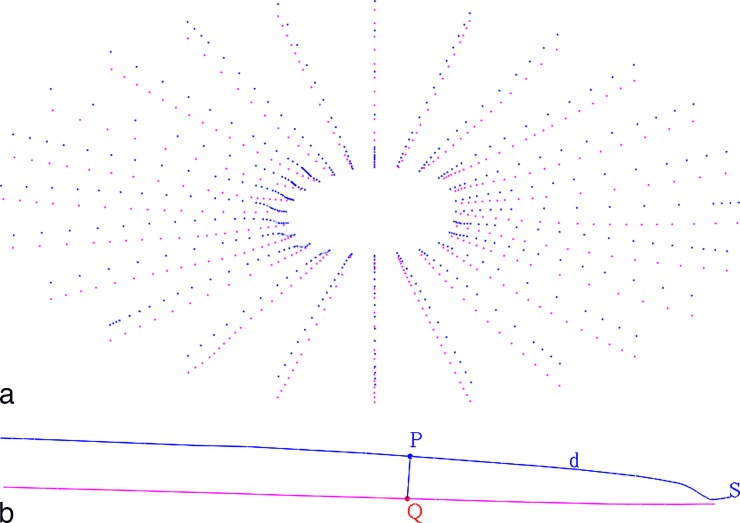
Figure 2.
Measurement of PCT. (a) Point cloud of PCT measurements between BM (blue) and AS (pink), based on the original manual delineation. In sampling PCT over a range, a uniform sampling of the choroid from a reconstruction of this delineation is used. (b) Algorithm used to compute PCT: BM (blue) half-section S; point P is d μm away from BMO; a ray along P's normal toward the AS (pink) intersects at point Q; the PCT of S at d μm is the distance between P and Q.

