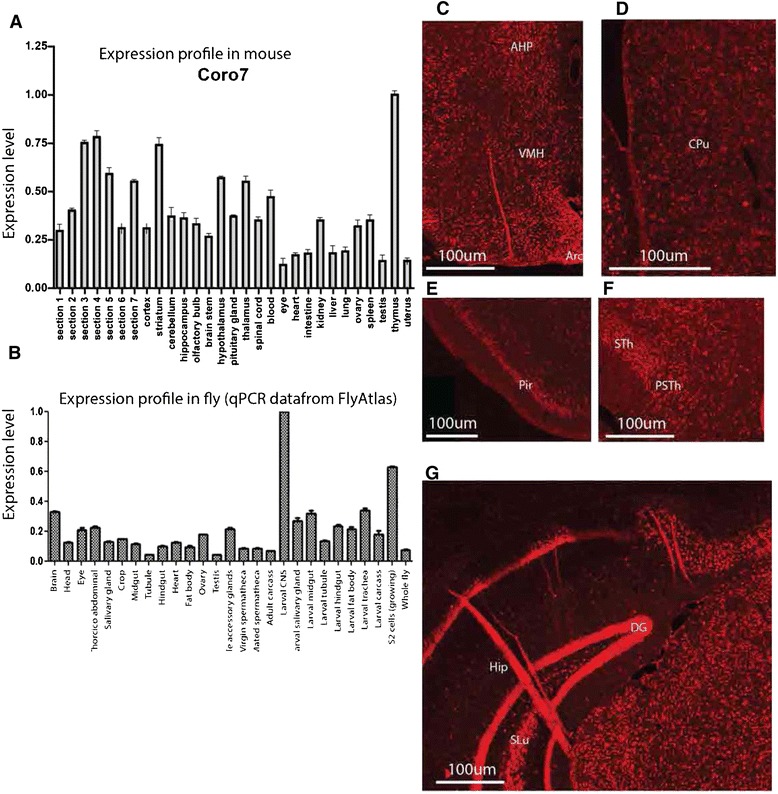
Figure 1.

Coro7 mRNA expression and tissue distribution in mouse periphery and brain. (A,B) Relative mRNA expression of the Coro7 gene was investigated in two species using real-time PCR. (A) Means are relative to tissue with the highest expression (set to 1) in mouse. (B) The expression of the CORO7 fly homolog pod1 was received from FlyAtlas microarray database, the expression is relative to the whole fly. Error bars represent SEM. (C-G) Floating fluorescent in situ hybridization on coronal sections using digoxigenin-labelled mouse Coro7 antisense probe to detect Coro7 mRNA expression patter. (C) hypothalamus, anterior hypothalamic part, posterior part (AHP), arcuate hypothalamic nucleus (Arc), ventromedial hypothalamic nucleus (VMH), (D) striatum, caudate putamen (CPu), (E) Piriform cortex (pir), (F) thalamus, subthalamic nucleus (STh), parasubthalamic nucleus (PSTh), (G) dentate gyrus (DG), stratum lucidum (SLu) hippocampus (hip). Scale bar: 0.2 mm.
