
Figure 2.
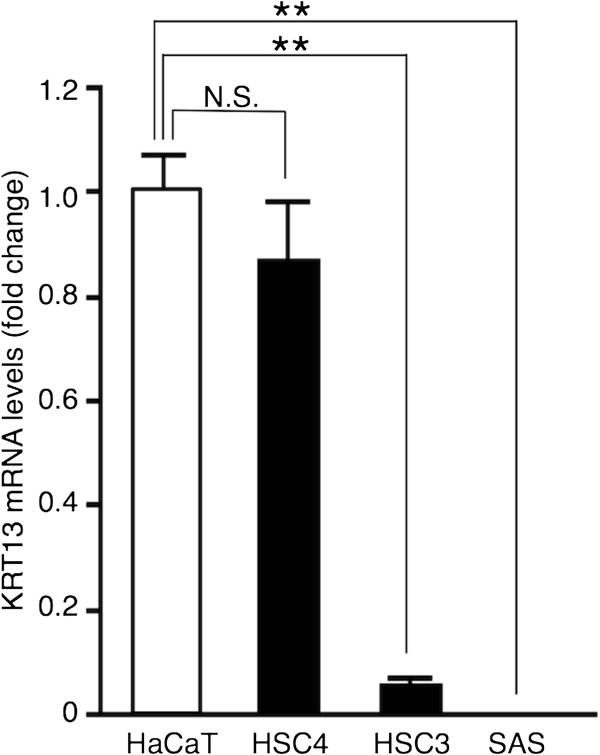
Silencing of the KRT13 gene in poorly differentiated OSCC cells. KRT13 mRNA levels in three OSCC cell lines and HaCaT cells were analyzed by quantitative reverse-transcription polymerase chain reaction (RT-PCR). Fold change in KRT13 mRNA was normalized to GAPDH and calculated relative to that of the HaCaT cells. The means ± SEM for each group (n = 3) are shown. Statistical analysis was performed by a one-way analysis of variance followed by Dunnett’s post hoc test. **p < 0.01, N.S. (not significant).