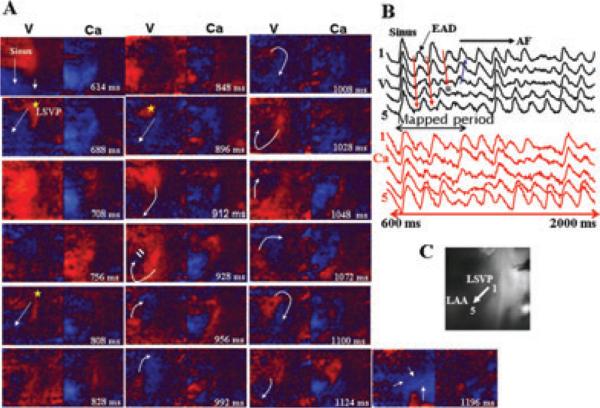
Figure 2.
Dual V-Cai2+ optical snap shots at the onset of spontaneous initiation of AF in an atrium isolated from a dog with chronic LVMI and perfused with tyramine (5 μM). Panel A shows snap shots of the last sinus beat followed by 3 focal activations (yellow asterisk) originating from the LSPV. The third activation undergoes wavebreak (frame 928 milliseconds) leading to 2 full clockwise reentrant activation wavefronts with subsequent emergence of irregular activation wavefronts (snap shot 1,196 milliseconds) indicative of AF. (The time during the first sinus beat is arbitrarily chosen as 600 milliseconds). White arrows in panel A indicate the direction of propagation. Panel B shows 5 consecutive simultaneous optical V-Cai2+ recordings from sites numbered 1-5 and shown on the atrial silhouette in panel C. The black double-headed arrow in panel B shows the mapped period, in panel A and the 3 downward pointing red arrows indicate the direction of the propagating EAD-mediated triggered beats. The double horizontal blue lines indicate the site of the block (also shown in Fig. 2A, frame 928 milliseconds), which is then followed by propagation in a direction opposite to the direction of the previous two triggered beats (upward pointing blue arrow in Fig. 2B). Notice the shorter optical APD of the last sinus beat (panel B, V, sites 1-5) relative to its underlying Cai2+ transient duration (panel B, Ca, site 1-5).

