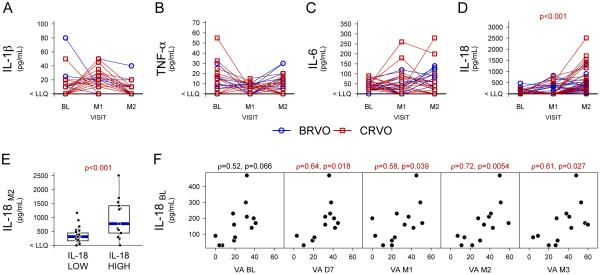
Figure 1. Aqueous levels of inflammatory cytokines in eyes of patients with retinal vein occlusion treated with ranibizumab.
Aqueous samples were obtained in 39 patients with macular edema due to central or branch retinal vein occlusion (CRVO or BRVO) at baseline (BL), 1 month after the first injection of ranibizumab (M1), and 1 month after the second injection (M2). Levels of interleukin (IL)-1β (A), tumor necrosis factor-α (TNF-α, B), IL-6 (C), and IL-18 (D) were measured by ELISA. Values below the lower limit of quantification (LLQ) are plotted at the y-axis lower limit (indicated as < LLQ). IL-18 levels are higher at M2 as compared to BL (p<0.001, Wilcoxon signed-rank test): BL and M2 median levels are < LLQ and 392.5 pg/mL respectively. Patients were categorized as “IL-18 high” (baseline level above the lower limit of quantification LLQ) or “IL-18 low” (below the LLQ) according to their IL-18 level at baseline and M2 IL-18 levels (IL-18M2) are plotted along the y-axis (E). IL-18 “high” patients had IL-18 levels that were significantly higher (p<0.001) than IL-18 “low” patients after 2 months of ranibizumab treatment. Baseline aqueous levels of IL-18 (IL-18BL) that were above the lower limit of quantification were plotted versus best-corrected visual acuity (VA; letters read at 4 meters on a standardized visual acuity chart from the Early Treatment Diabetic Retinopathy Study) and there was no correlation (F). However, IL-18BL levels correlated (Spearman's Rank Order p<0.05) with visual acuity at each of the time points after initiation of ranibizumab treatment, day 7 (D7), month 1 (M1), month 2 (M2), and month 3 (M3).

