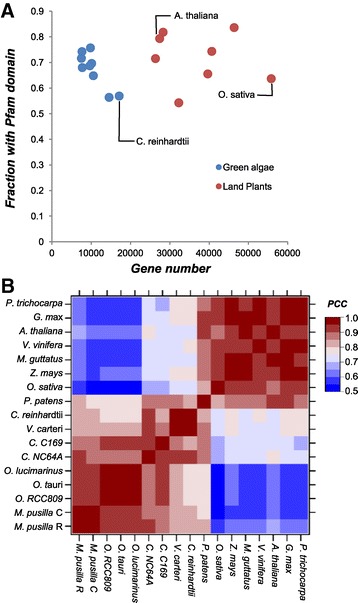
Figure 1.

Domain families in green algae and land plants. (A). The coverage of Pfam domain annotation in green algal (blue) and land plant (red) genomes. X axis indicates the numbers of genes in each species, and Y axis indicates the proportion of genes with ≥1 domains. (B). Correlation of domain family size profiles among green algae and land plants. The color scale indicates the range of Pearson’s Correlation Coefficient (PCC) of domain family sizes between two species. Refer to methods for abbreviations.
