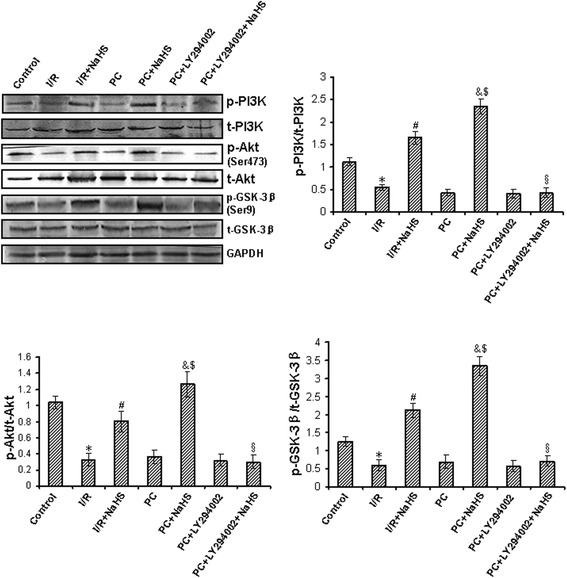
Figure 7.

The change of PI3K-Akt-GSK-3β pathway. The phosphorylation of PI3K, Akt and GSK-3β was detected using Western bloting. The graphs represent the optical density of the bands of phosphorylated PI3K, Akt and GSK-3β normalized with the expression of total PI3K, Akt and GSK-3β, respectively. All data were from four independent experiments. * p < 0.05 vs. control group; # p < 0.05 vs. I/R group; & p < 0.05 vs. PC group; $ p < 0.05 vs. I/R + NaHS group; § p < 0.05 vs. PC + NaHS group.
